
Stop Guessing: A Systematic Guide to Fixing CUDA Out of Memory Errors in GRPO Training

# GRPO
# CUDA
# GPU Memory
# LLM Training
A practical guide to diagnosing GPU memory issues instead of randomly changing hyperparameters until something works
February 4, 2026
Subham Kundu
Last week, I was building a reinforcement learning model for a customer using GRPO (Group Relative Policy Optimization) with Unsloth. Everything was configured, the dataset was ready, and then
torch.OutOfMemoryError: CUDA out of memory. Tried to allocate 6.01 GiB.
GPU 0 has a total capacity of 22.03 GiB of which 2.72 GiB is free.Sound familiar?
Here’s what I’ve noticed: when most people hit an OOM error, they start randomly tweaking parameters. Reduce batch size. Didn’t work? Cut sequence length in half. Still crashing? Lower the LoRA rank. It’s trial and error with no real understanding of why things work or don’t.
I take a different approach. Before changing anything, I want to know exactly where my memory is going. Then I can make targeted changes that actually solve the problem without unnecessarily degrading my training setup.
This guide is that approach, distilled into something practical you can use today.
Reading the Error Message (It Tells You Everything)
That error message isn’t just noise. Let’s actually read it:
Tried to allocate 6.01 GiB.
GPU 0 has a total capacity of 22.03 GiB of which 2.72 GiB is free.
Including non-PyTorch memory, this process has 19.29 GiB memory in use.Here’s what this tells us:
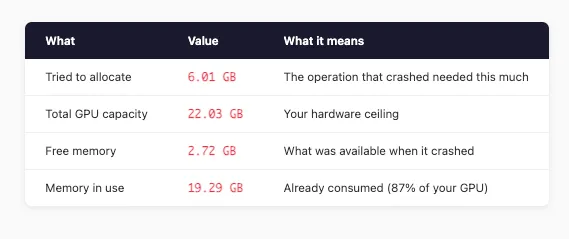
The math is simple: needed 6.01 GB, had 2.72 GB. We’re about 3.3 GB short.
The traceback also tells you where it happened—in my case, during
_get_per_token_logps_and_entropies when computing logits = model(**model_inputs).logits. This is the forward pass computing output logits for all tokens in the batch.Now we know the problem. Let’s figure out what’s eating our memory.
Where Does GPU Memory Actually Go in GRPO?
Before touching any config, you need to understand the memory consumers. In GRPO training, there are three main categories:
1. Model Memory (Usually Small)
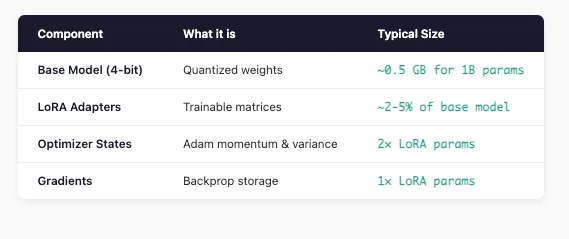
For a 1B parameter model with LoRA, this is usually under 1 GB total. Not our problem.
2. vLLM Inference Memory (The Hidden Hog)
GRPO uses vLLM for fast generation. Here’s the thing most people miss: vLLM reserves a fixed chunk of your GPU upfront.
GPU_MEMORY_UTILIZATION = 0.6 # vLLM takes 60% of GPUOn a 22GB GPU, that’s 13.2 GB gone before training even starts. This is often the biggest memory consumer and the easiest to adjust.
3. Training Activations (The Main Culprit)
This is where OOM errors usually originate. Activation memory scales with:
- Batch size (PER_DEVICE_TRAIN_BATCH_SIZE)
- Sequence length (MAX_SEQ_LENGTH)
- Number of generations (NUM_GENERATIONS)
- Model architecture (hidden dimensions, layers)
Activation Memory ≈ batch_size × seq_length × hidden_dim × num_layers × 2 bytesFor Gemma 3 1B (hidden_dim=2048, 18 layers) with batch=4, seq=1024:
≈ 4 × 1024 × 2048 × 18 × 2 bytes ≈ 300 MB per forward passBut here’s the kicker: GRPO generates
NUM_GENERATIONS completions per prompt. With NUM_GENERATIONS=4, you’re multiplying that memory usage.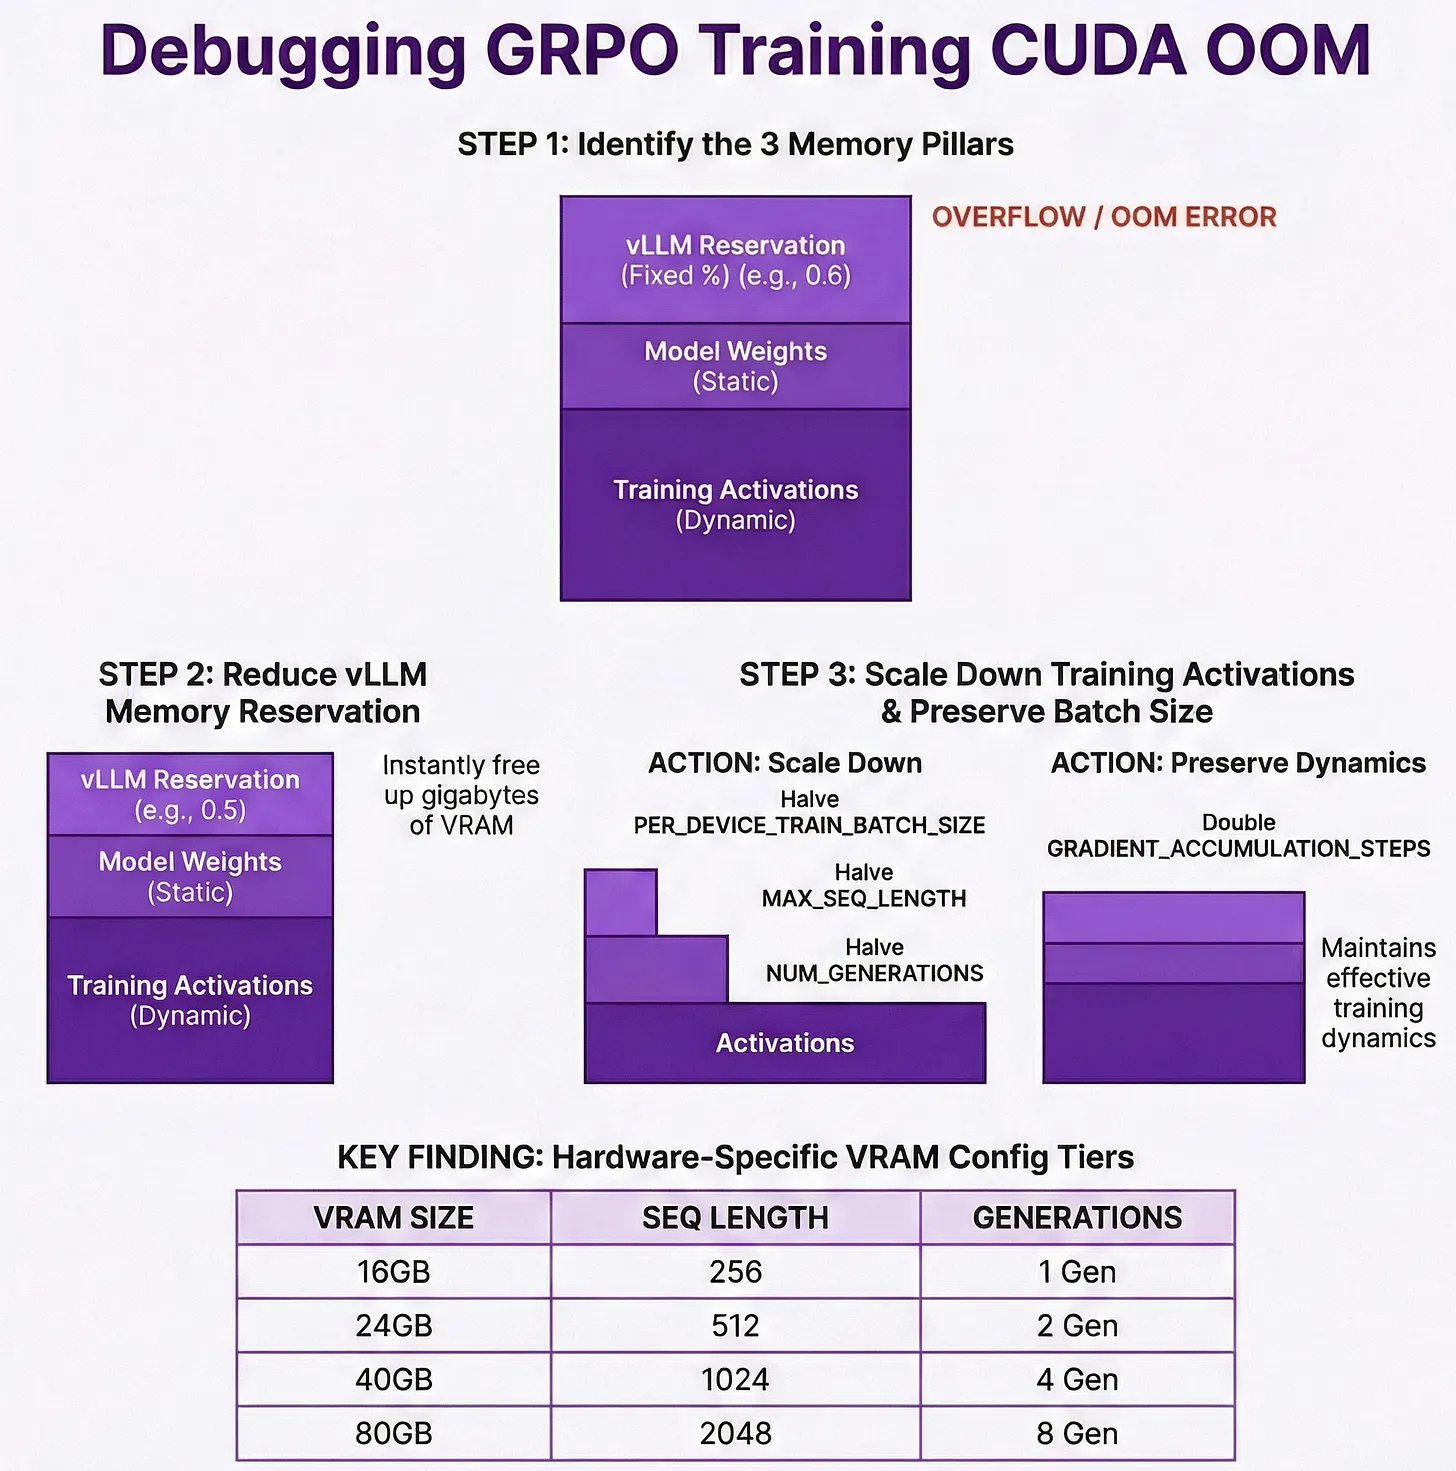
The Debugging Process: Show Your Work
Let me walk through exactly how I diagnosed my OOM error.
Step 1: List Everything
My original config:
MAX_SEQ_LENGTH = 1024
LORA_RANK = 32
GPU_MEMORY_UTILIZATION = 0.6
PER_DEVICE_TRAIN_BATCH_SIZE = 4
NUM_GENERATIONS = 4Step 2: Calculate Each Component
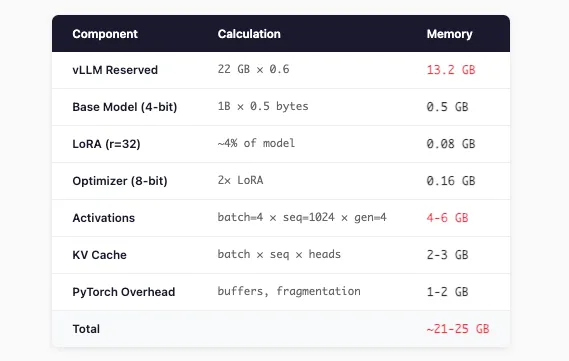
My GPU has 22 GB. I’m trying to fit 21-25 GB. No wonder it crashed.
Step 3: Identify the Biggest Levers
Priority order by impact:
- GPU_MEMORY_UTILIZATION — Directly controls vLLM’s reservation. Biggest single lever.
- NUM_GENERATIONS — Multiplies completion memory
- PER_DEVICE_TRAIN_BATCH_SIZE — Multiplies all activations
- MAX_SEQ_LENGTH — Affects activations and KV cache
- LORA_RANK — Smaller impact, but contributes
The Fix: Targeted Changes
Based on the analysis, here’s my optimized config for a 22GB GPU:
# Model Configuration
MODEL_NAME = "google/gemma-3-1b-it"
MAX_SEQ_LENGTH = 512           # Reduced from 1024
LORA_RANK = 16                 # Reduced from 32
LOAD_IN_4BIT = True
GPU_MEMORY_UTILIZATION = 0.5   # Reduced from 0.6 (saves ~2.2 GB)

# Training Configuration
PER_DEVICE_TRAIN_BATCH_SIZE = 2  # Reduced from 4
GRADIENT_ACCUMULATION_STEPS = 2  # Increased to maintain effective batch size
NUM_GENERATIONS = 2 # Reduced from 4New Memory Calculation
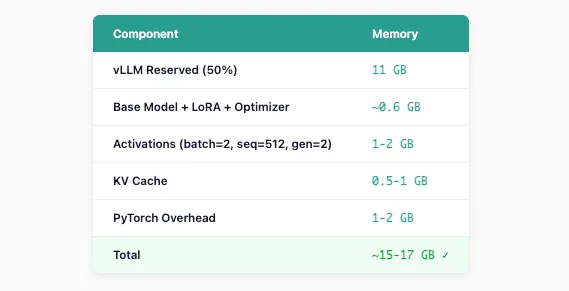
Headroom: 22 - 17 = ~5 GB free ✓
Preserving Training Dynamics
Notice I didn’t just slash everything—I increased
GRADIENT_ACCUMULATION_STEPS:Original: batch_size=4 × grad_accum=1 = effective batch of 4
New: batch_size=2 × grad_accum=2 = effective batch of 4 ✓Same effective batch size, similar training dynamics.
Quick Reference: Configs by GPU Size
Here’s what I’ve found works reliably across different hardware:
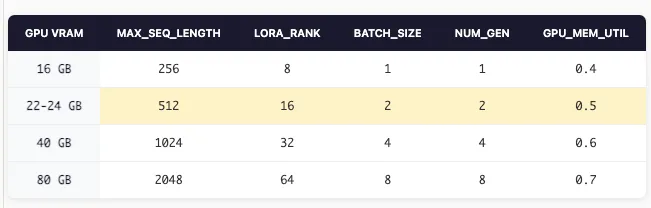
These aren’t magic numbers—they’re starting points based on the memory math above. Adjust based on your specific model and dataset.
Still Getting OOM? Emergency Measures
If you’ve applied the above and still hitting memory limits:
1. Reduce vLLM further
GPU_MEMORY_UTILIZATION = 0.4 # Aggressive, but works2. Trim LoRA targets
# Instead of targeting everything, keep only essentials
LORA_TARGET_MODULES = ["q_proj", "v_proj"] # Remove k_proj, o_proj, etc.3. Set PyTorch memory config
export PYTORCH_CUDA_ALLOC_CONF=expandable_segments:True4. Monitor in real-time
watch -n 1 nvidia-smiOr in Python:
import torch
print(f"Allocated: {torch.cuda.memory_allocated()/1e9:.2f} GB")
print(f"Reserved: {torch.cuda.memory_reserved()/1e9:.2f} GB")
Understanding the Trade-offs
Every change has a cost. Know what you’re trading:
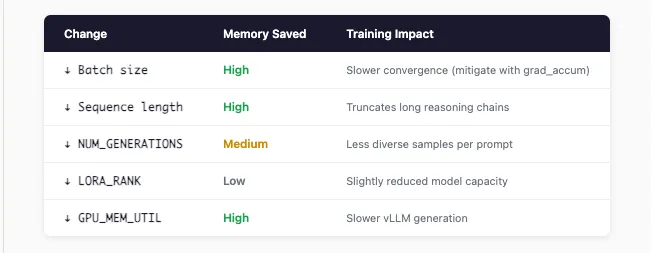
The goal isn’t to minimize memory—it’s to find the configuration that maximizes training quality within your hardware constraints.
The Takeaway
Stop randomly tweaking hyperparameters when you hit OOM. Instead:
- Read the error — It tells you exactly how much memory you need vs. have
- Map out your memory consumers — vLLM reservation, model, activations
- Calculate before changing — Know where your memory is going
- Target the biggest levers first — Usually vLLM util and batch size
- Preserve what matters — Use gradient accumulation to maintain effective batch size
The difference between debugging systematically and debugging randomly is the difference between solving the problem in 10 minutes vs. 3 hours of frustration.
Hope this saves you some time on your next RL training run.
Dive in
Related
Video
Fixing GPU Starvation in Large-Scale Distributed Training
By Kashish Mittal • Apr 3rd, 2026 • Views 220
Video
Unlocking AI Agents: Fixing Authorization to Get Real Work Done // Sam Partee // AI in Production 2025
By Samuel Partee • Mar 14th, 2025 • Views 502
Video
From Guesswork to Greatness: Systematic AI Agent Optimization in Production // Nimrod Busany // Agents in Production 2025
By Nimrod Busany • Jul 25th, 2025 • Views 128
Video
Getting Humans Out of the Way: How to Work with Teams of Agents
By Robert Ennals • Apr 7th, 2026 • Views 162
Video
Fixing GPU Starvation in Large-Scale Distributed Training
By Kashish Mittal • Apr 3rd, 2026 • Views 220
Video
From Guesswork to Greatness: Systematic AI Agent Optimization in Production // Nimrod Busany // Agents in Production 2025
By Nimrod Busany • Jul 25th, 2025 • Views 128
Video
Getting Humans Out of the Way: How to Work with Teams of Agents
By Robert Ennals • Apr 7th, 2026 • Views 162
Video
Unlocking AI Agents: Fixing Authorization to Get Real Work Done // Sam Partee // AI in Production 2025
By Samuel Partee • Mar 14th, 2025 • Views 502