
Building a Machine Learning Pipeline With DBT

This blog is written by Jeff Katz , the Founder of JigSaw Labs
June 5, 2022
Jeff Katz

Jeff Katz
Setting up a proper data pipeline that performs feature engineering, trains, and makes predictions of our data can become pretty complicated. But it doesn’t have to be. Let’s walk through it step-by-step.
We’ll use BigQuery ML to train and make predictions directly in our database. Then we’ll see how we can use a tool like DBT to develop a data pipeline that performs feature engineering, trains, and makes predictions, all without moving data from our database.
Let’s get started.
Setting Up BigQuery
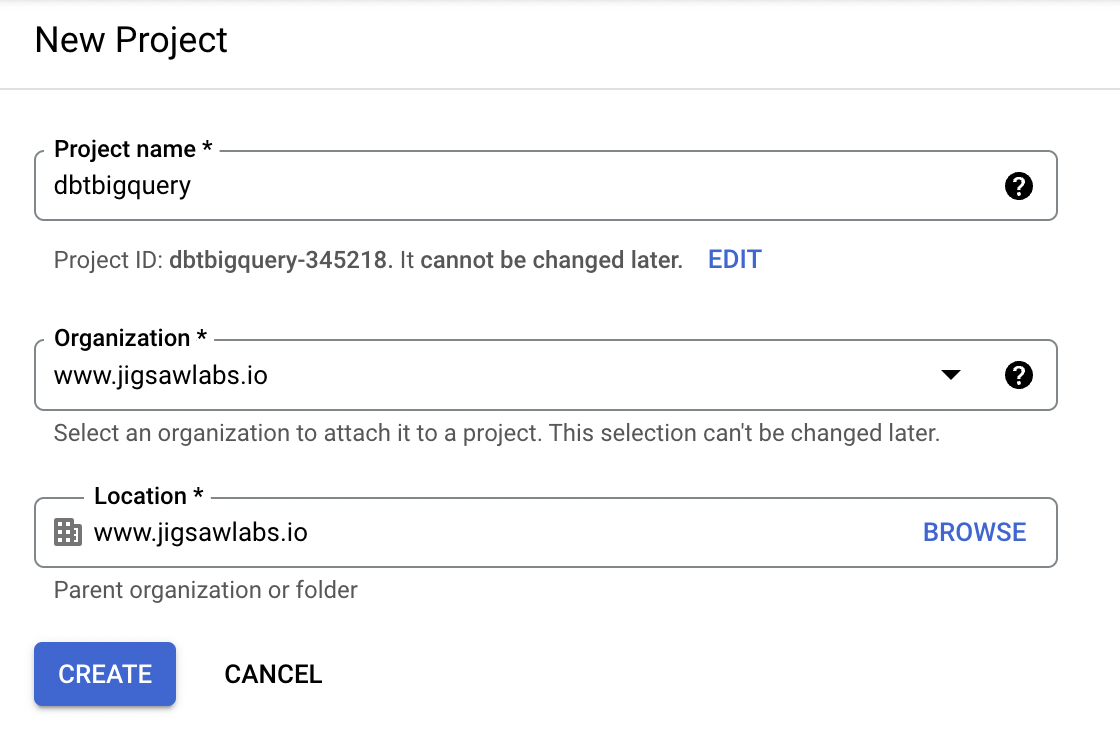
The first step is to go to the Google Cloud Console , create a new project, and give it a name. We’ll call ours `dbtbigquery`.
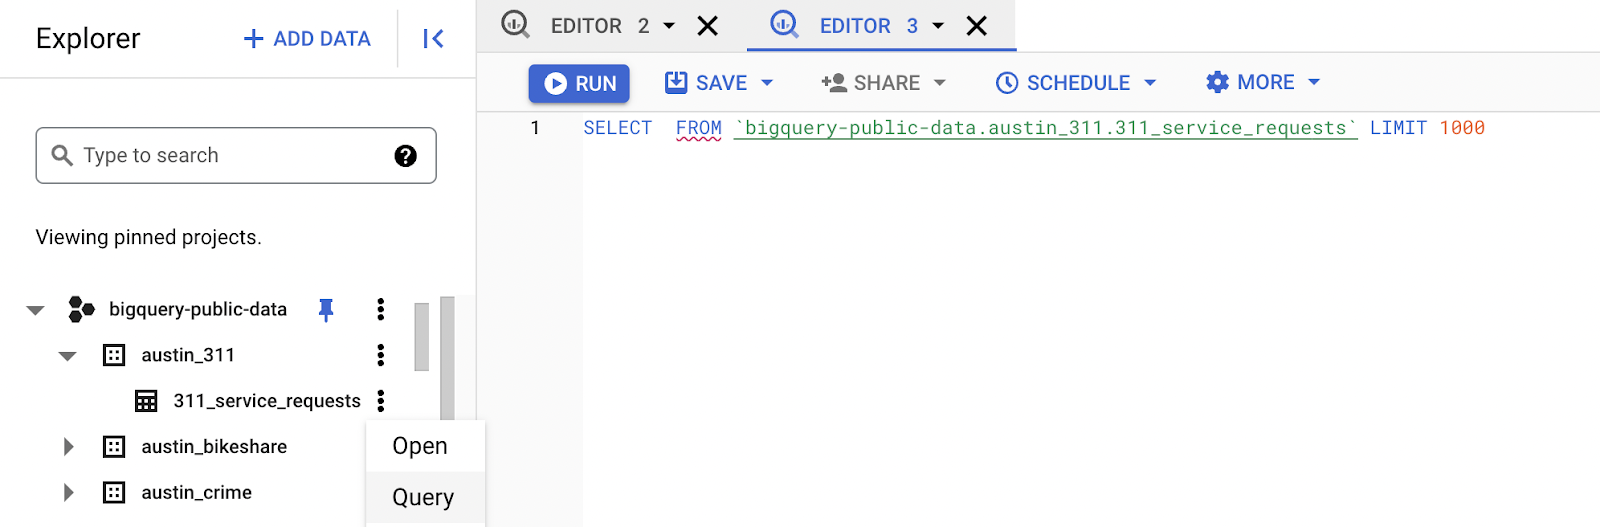
Now you can begin to perform queries. Google makes certain datasets publicly available, which is listed under `bigquery-public-data`. If you click on the first database, `austin_311` followed by the table inside of a dataset, and then click on ‘Query’, Google will place a sample query in your editor.
You just have to specify the columns you would like to query. If you change the above query to `SELECT * FROM `bigquery-public-data.austin_311.311_service_requests` LIMIT 100;`, and then click the blue ‘Run’ button, you’ll have performed your first query.
Loading a Dataset and Introducing Google ML
Ok, so now that you’ve gotten up and running with Google BigQuery. The next step is to upload some sample data to BigQuery and perform some machine learning on it. For this lesson, we can use some sample user event data.
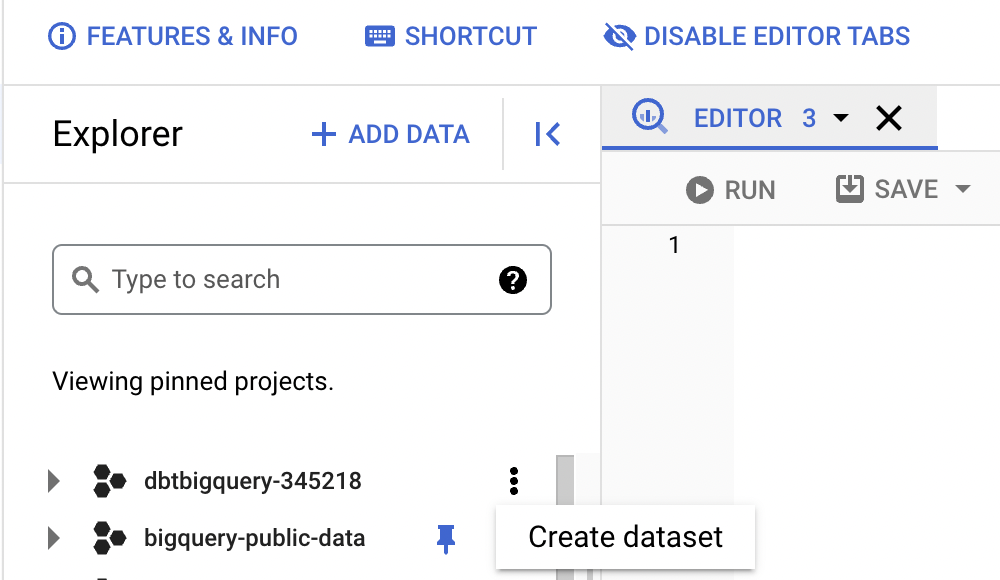
We can call the dataset mixpanel, and from there, we can create a new table.
Enter the following information in the form that’s displayed.
- Under `Select Drive URI`, you can enter the following url .
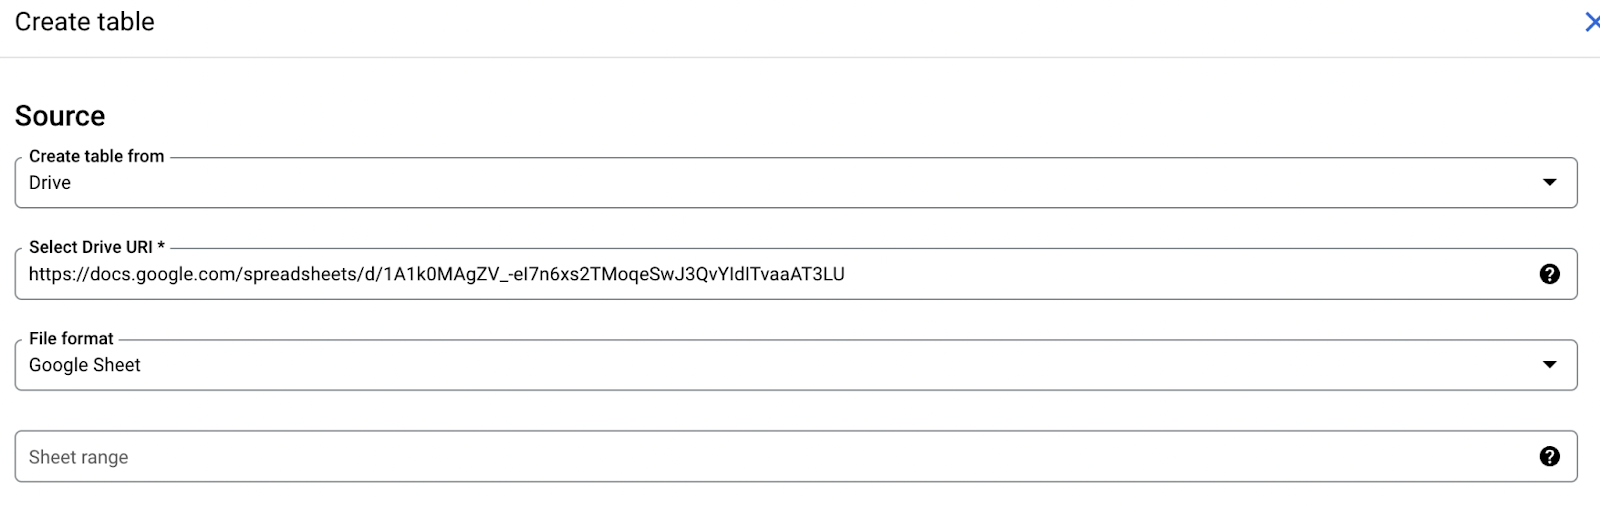
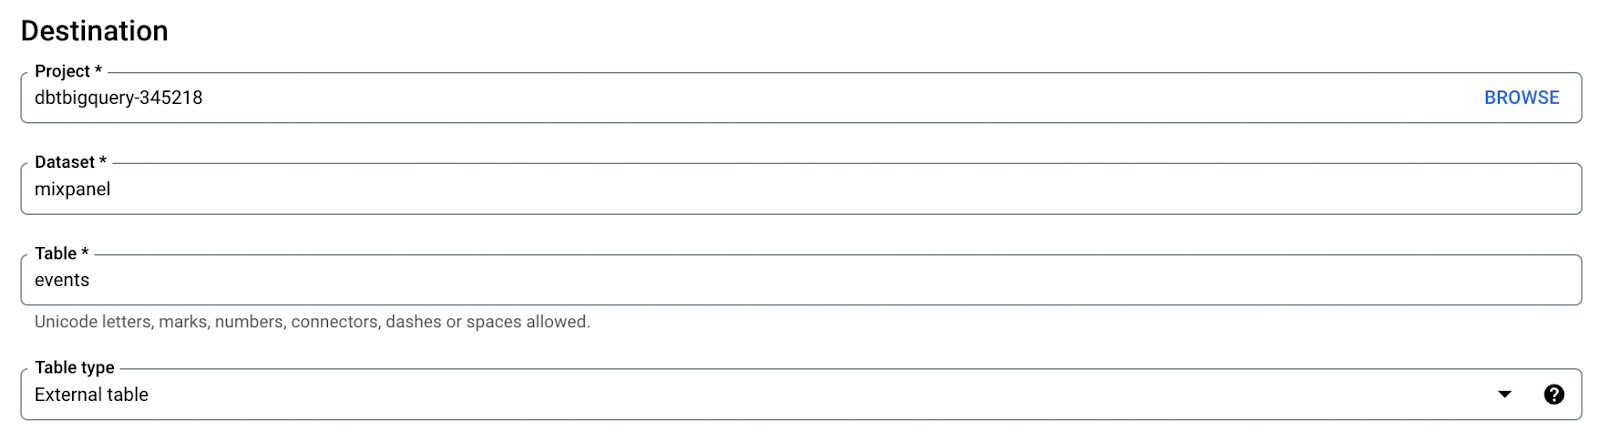
Next, under the project line, click on browse and select the project you would like to create the dataset in, if it is not already selected.
Finally, make the following changes under the schema section.
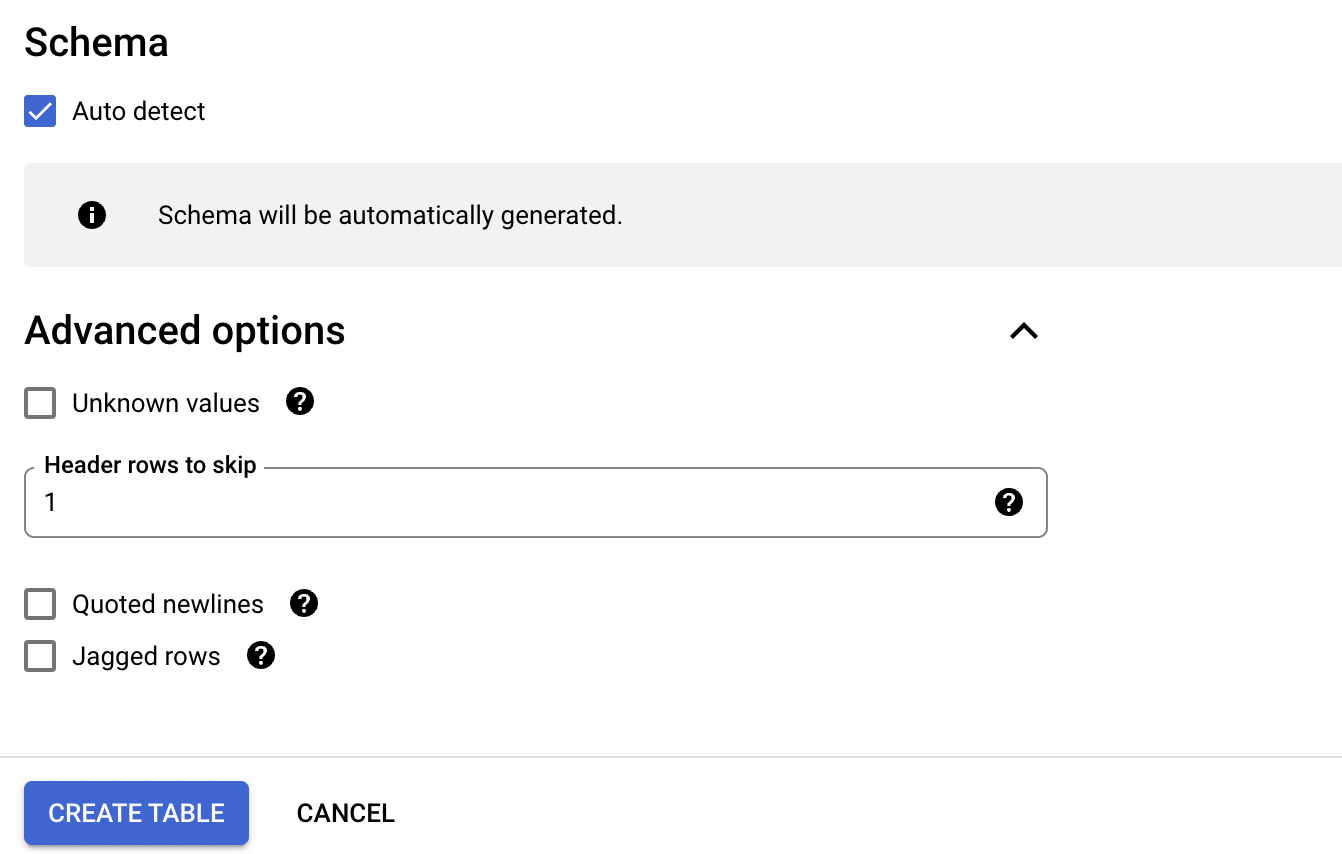
Make sure that you check ‘Auto detect’ so the schema is generated for you, skip one header row. Click on ‘Create Table’. If you click on the newly created table, you should see something like this:
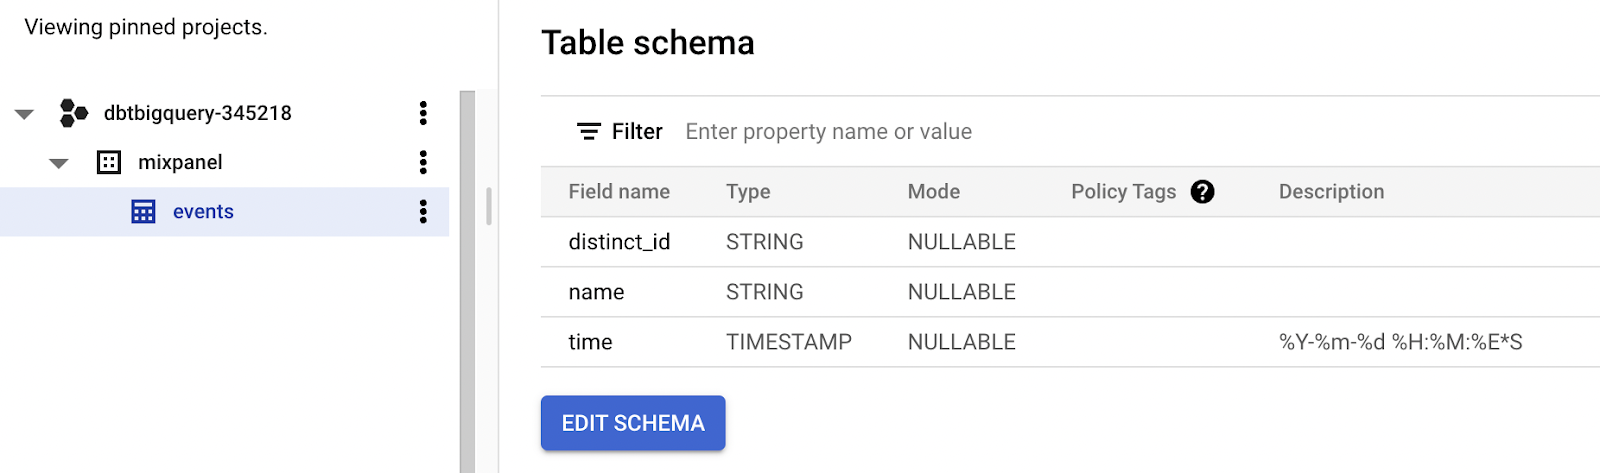
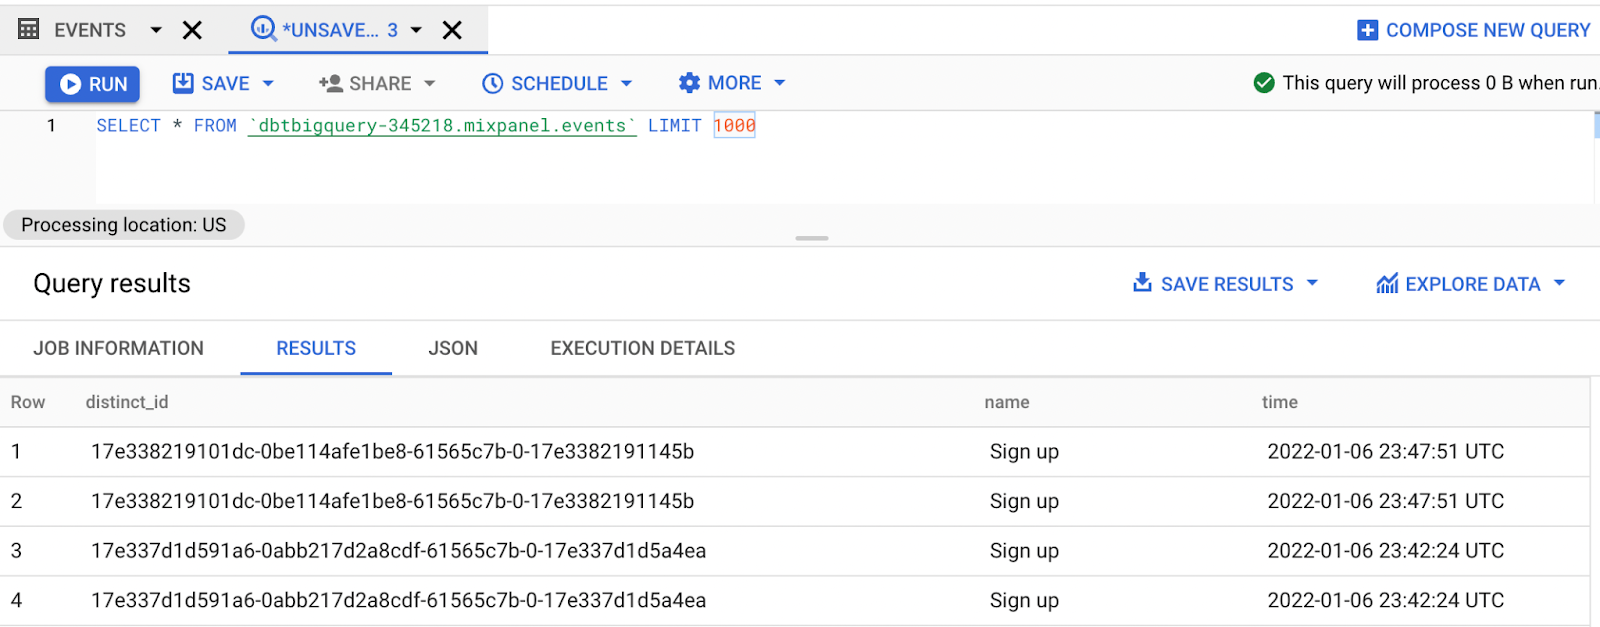
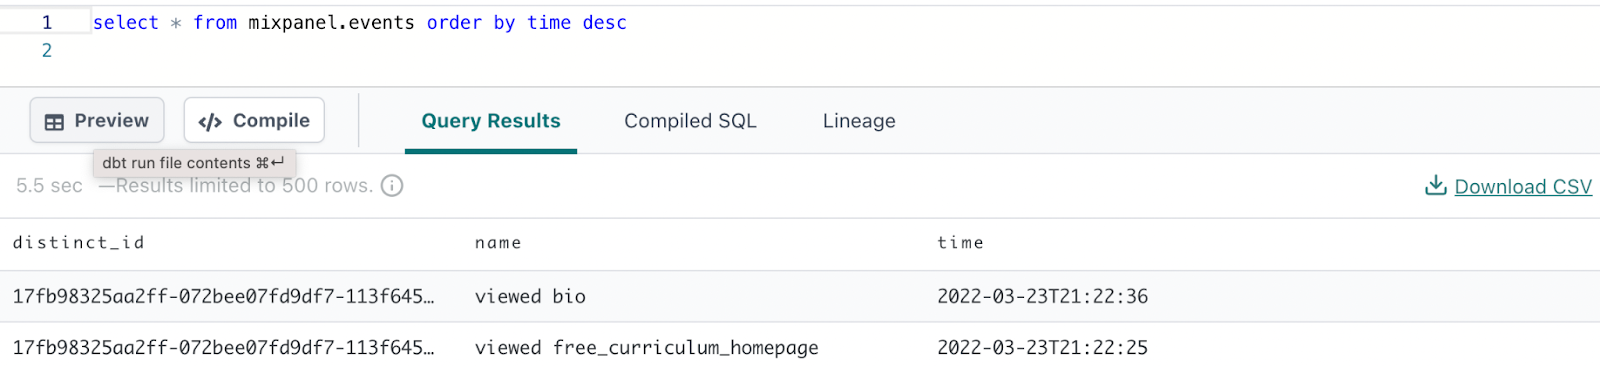
Finally, you can look at some of the data, by performing a `SELECT *` to get a sense of the data.
Feature Engineering
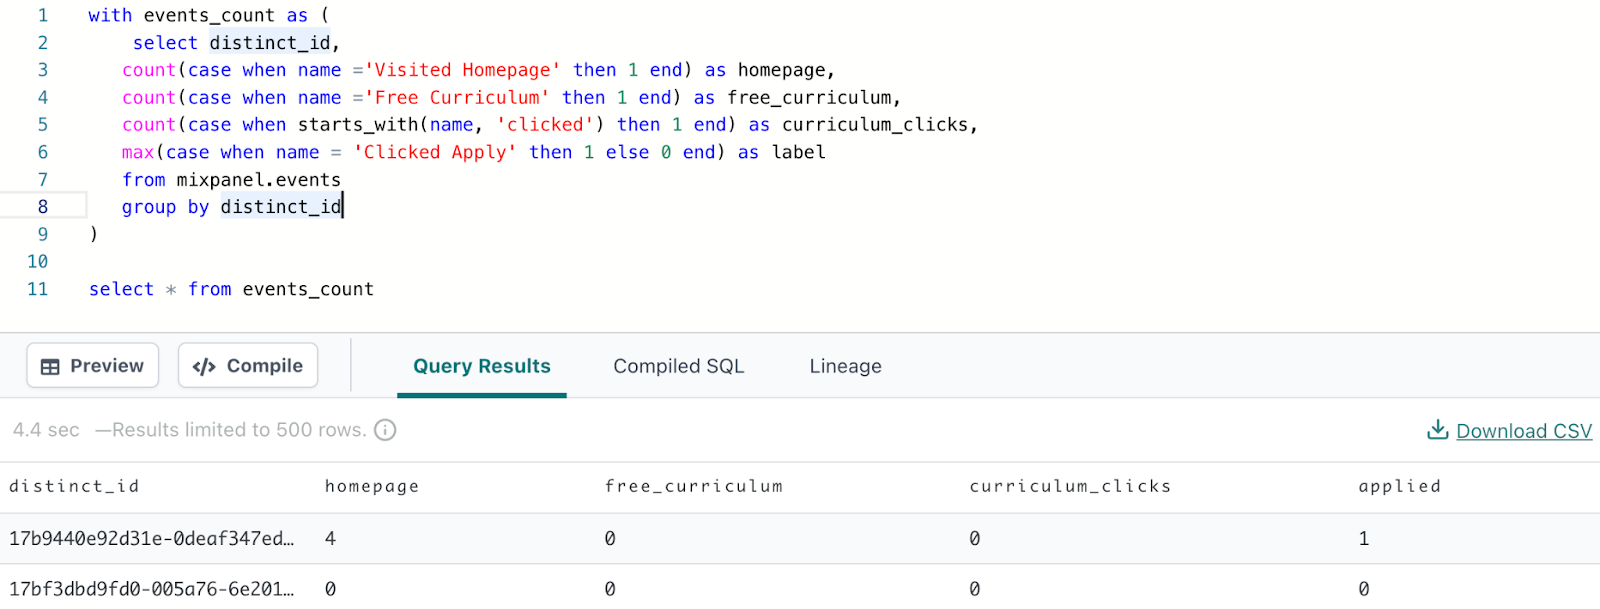
So now that you’ve loaded your data into BigQuery, the next step is to convert data into a format that is appropriate for machine learning. Taking another look at your data, you can see that we have data on different users, represented by the `distinct_id`, each of whom performs different actions, like visiting the signup page, the curriculum page, or clicking on the apply button.
What we want to do is convert our data so that each user is represented by one row, and that we have columns indicating the number of times each user performed certain actions like visiting different pages. You can do that by performing the following:
It should result in this:
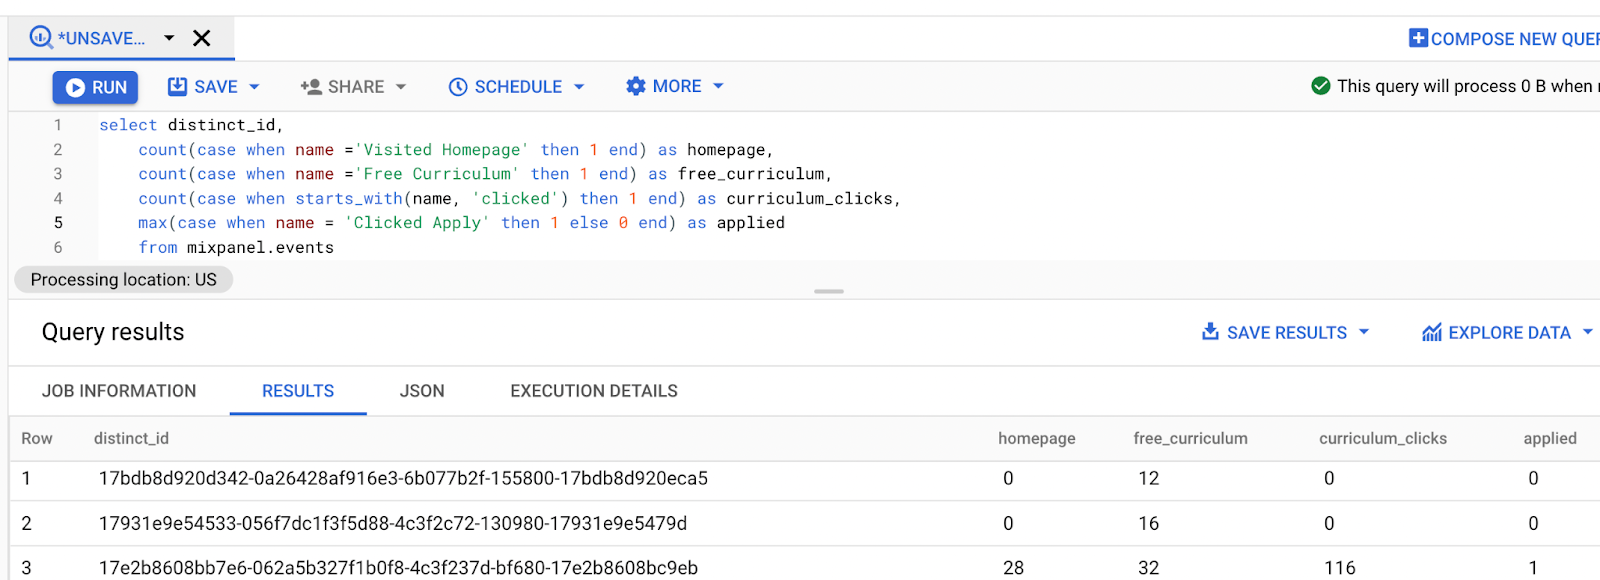
We used the name column – which contains the name of the event the user performed – to count up the number of times the user visited the homepage, the free curriculum page, or actually clicked on curriculum.
The values in the homepage, free_curriculum, and curriculum_clicks columns will be the inputs to our machine learning algorithm. And we’ll use the inputs to predict whether or not a student clicks on the apply button.
Because we don’t care how many times a person clicks to apply – we only care whether they apply or they don’t – we perform a `max()` instead of a `count`, as the max will result if the user applies in any of the events, and a 0 otherwise.
We call the inputs to the machine learning algorithm our features, and the item we are trying to predict the target.
Building an ML Model
Now that we’ve performed some feature engineering, it’s time to train a machine learning model that predicts whether or not someone will click the apply button. There are a couple of reasons why you may want to do this:
- Predicting whether someone is likely to click the apply button can help us identify sales leads that should be reached out to. The more likely they are to apply, the more likely they are to purchase.
- We can see which features are most relevant to a person applying, potentially indicating certain web pages that make a person more likely to apply. This can help direct marketing efforts.
Get a sense of learning how to use BigQuery ML by looking at the linear regression tutorial . Looking at the `Create Model` section, you’ll see the following:
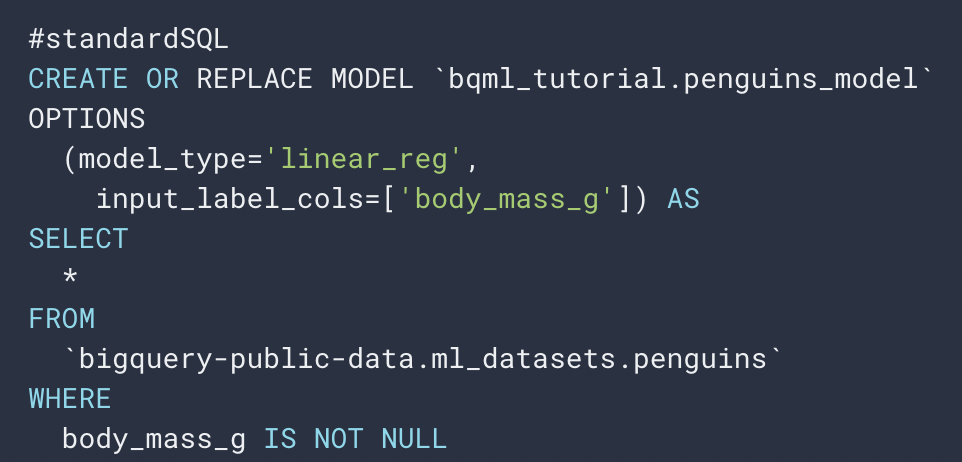
Let’s understand this by beginning at the select statement. The select statement defines all of the inputs to our machine learning model. Select all of the columns in the `bigquery-public-data.ml_datasets.pengins` table. Then, in the CREATE MODEL statement, define the model you want to create. We created the model in the `bqml_tutorial` dataset with the name of `penguins_model`. Then under `OPTIONS` specify the model type as a linear regression model, and specify the label column – that is, the column you are trying to predict – as the body mass column.
So if you adjust this example to match your problem it looks like the following:
> Note: The below statement will not yet work.
Leave out selecting the `distinct_id` column, as the user id is not a relevant input to predicting if someone clicks to apply for the program. In the CREATE MODEL statement, create the `events_model` in the `mixpanel` dataset. Notice that we changed the model_type to `logistic_reg`, as this is a classification problem, and we specified the `input_label_cols` as `label` because this is the column we are trying to predict.
Of course, there is one problemwith this, and it’s that we have not yet created a table that has these columns of the homepage, free_curriculum, and curriculum_clicks, and label. All we did so far was perform a select statement that results in these columns. So let’s create that table that has the necessary columns – and to do so, we’ll use DBT.
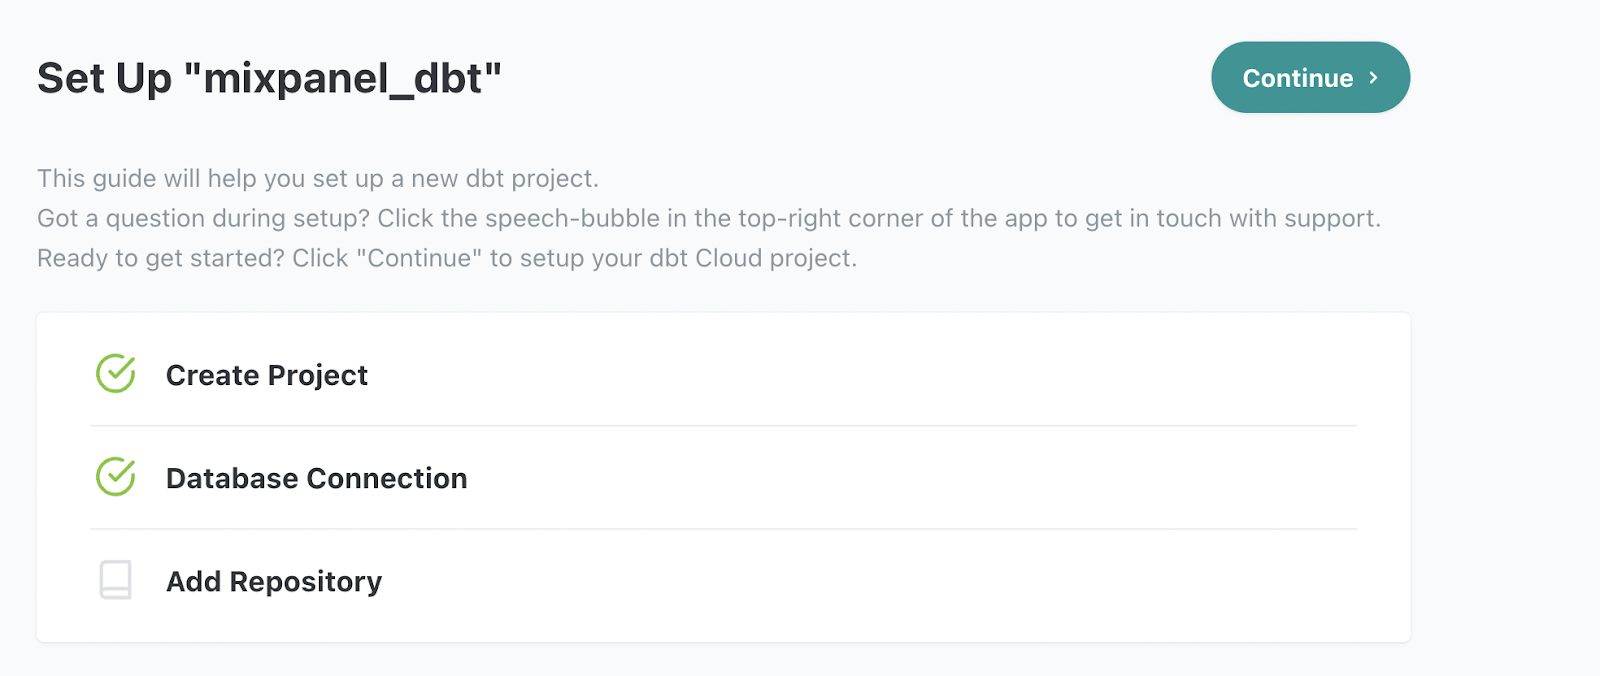
Setting up DBT
DBT has multiple use cases in our machine learning pipeline. First, it will allow us to organize our SQL queries in a code repository that is connected to SQL. Second, it can build a SQL pipeline so that, if we get new data, we first perform feature engineering, then we train a model, and finally, we can make predictions with that data. These benefits will become clear when we see it in action.
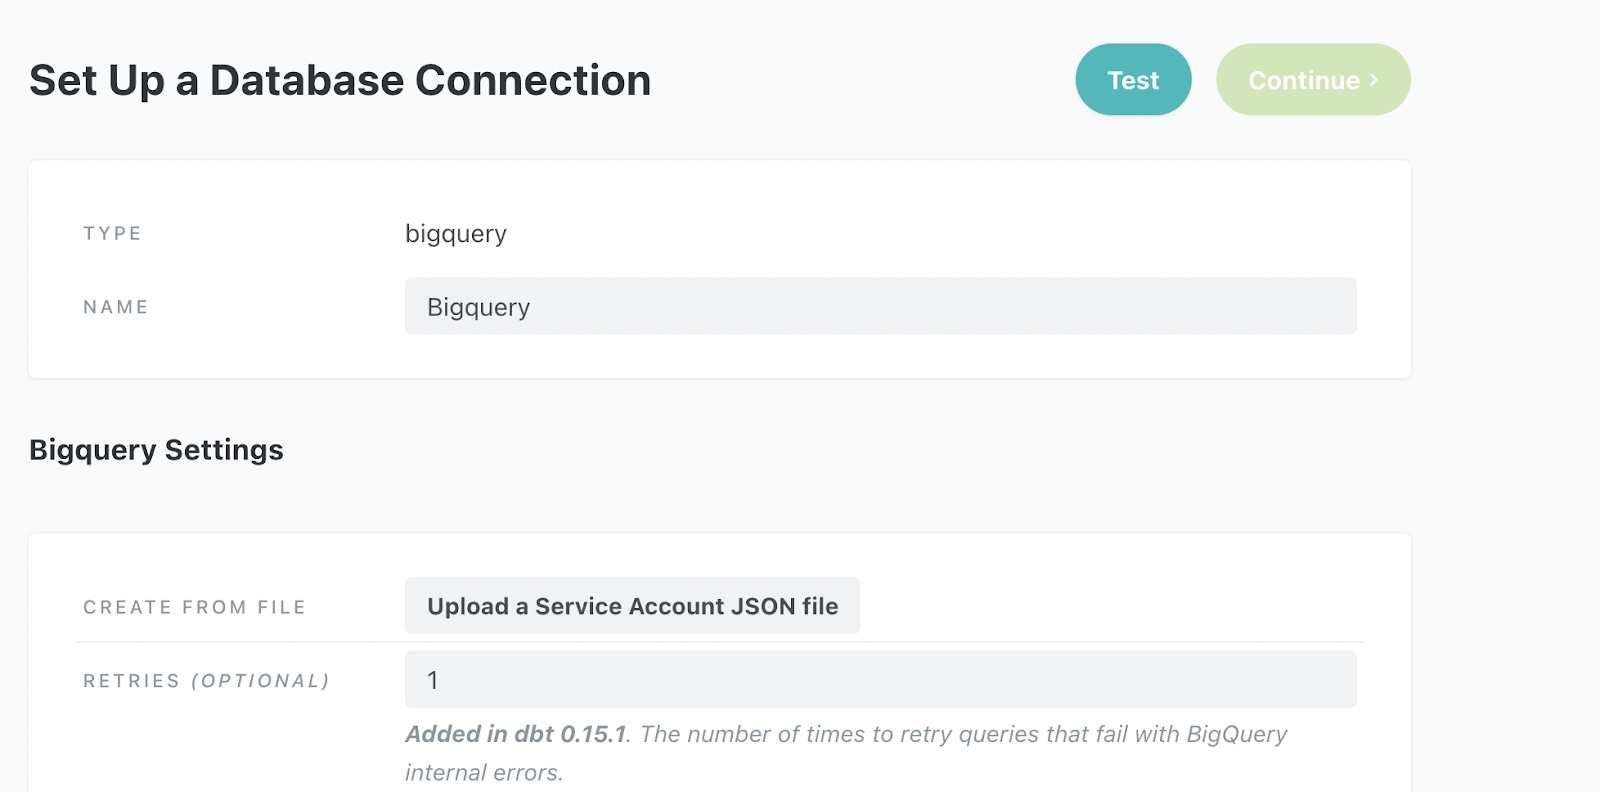
DBT will run SQL commands on our analytics database so the first step is to sign up for DBT and connect it to your BigQuery database.
And from there we can click on New Project.

From there, enter in a project name of mixpanel_dbt and select a data warehouse of BigQuery. You’ll be prompted to enter credentials so that the DBT project will be authorized to connect to your BigQuery database.
The easiest way to connect your database is to use the Upload a Service Account JSON File.
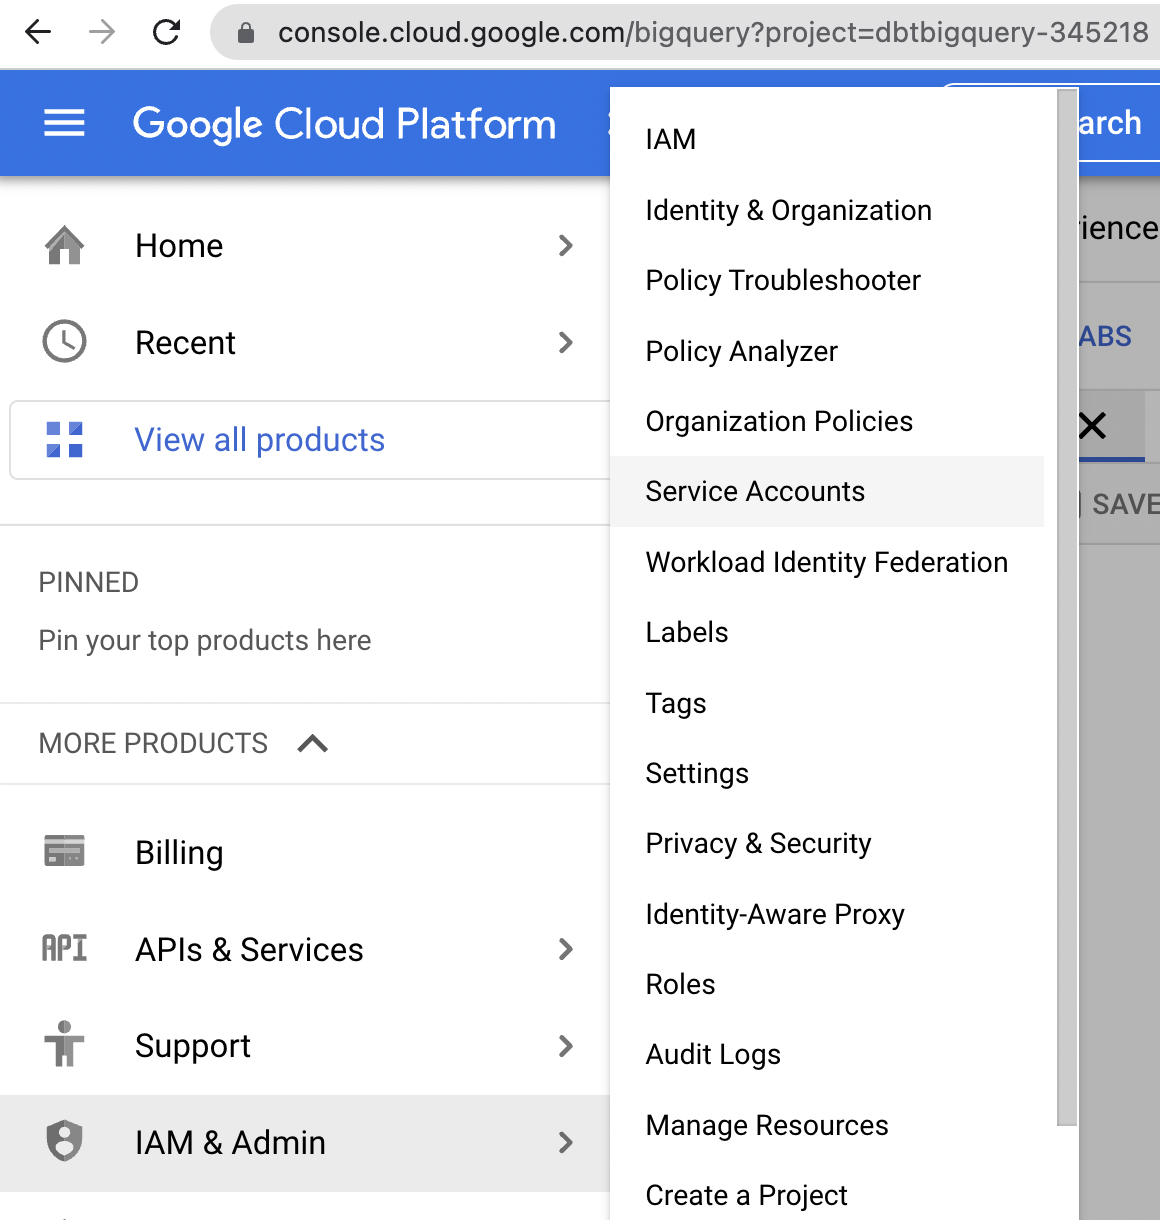
Generate the file by going back to your BigQuery account and performing the following:
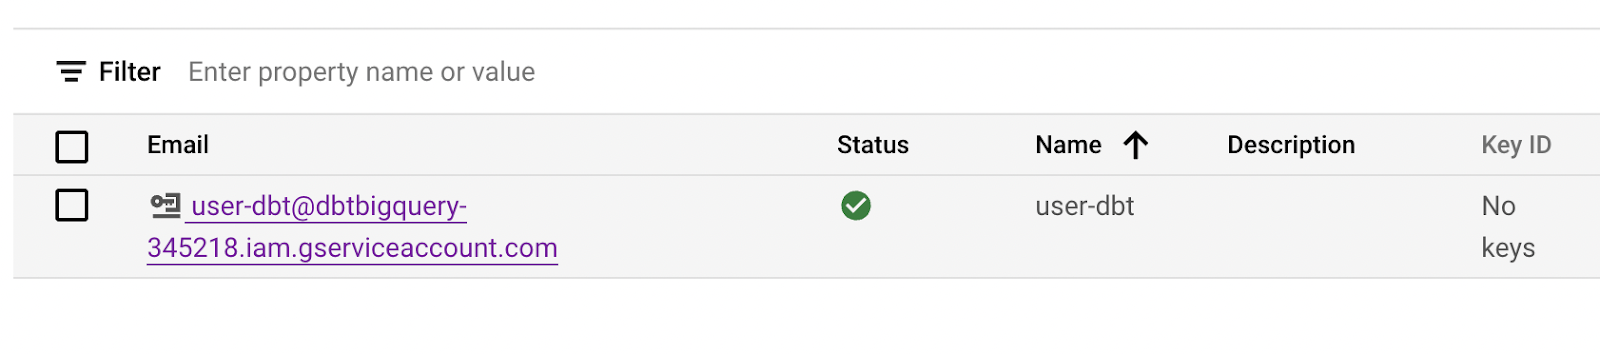
- Go to IAM & Admin > Service Accounts or just click here .
> A service account is used to authorize systems to your BigQuery account – here that system is DBT.
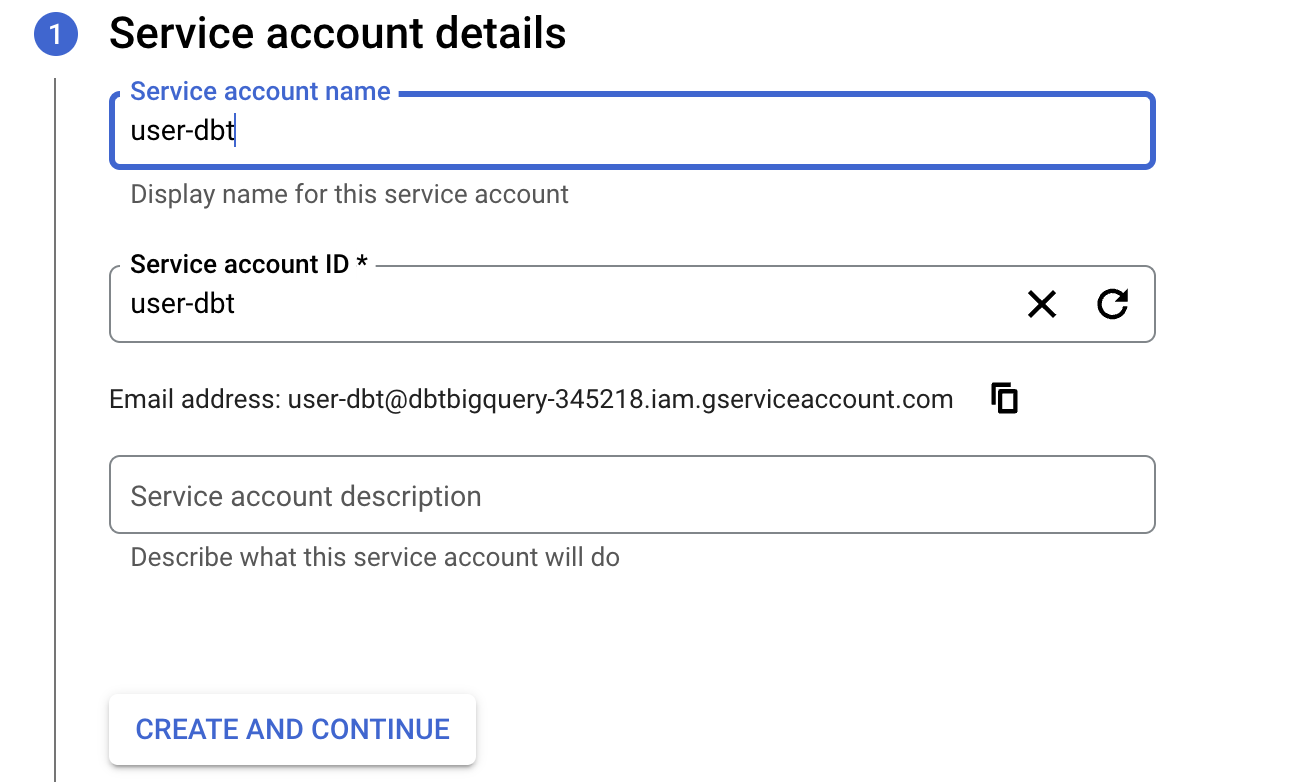
- From there, set the service account name as `user-dbt`, and then click ‘Create and Continue’.
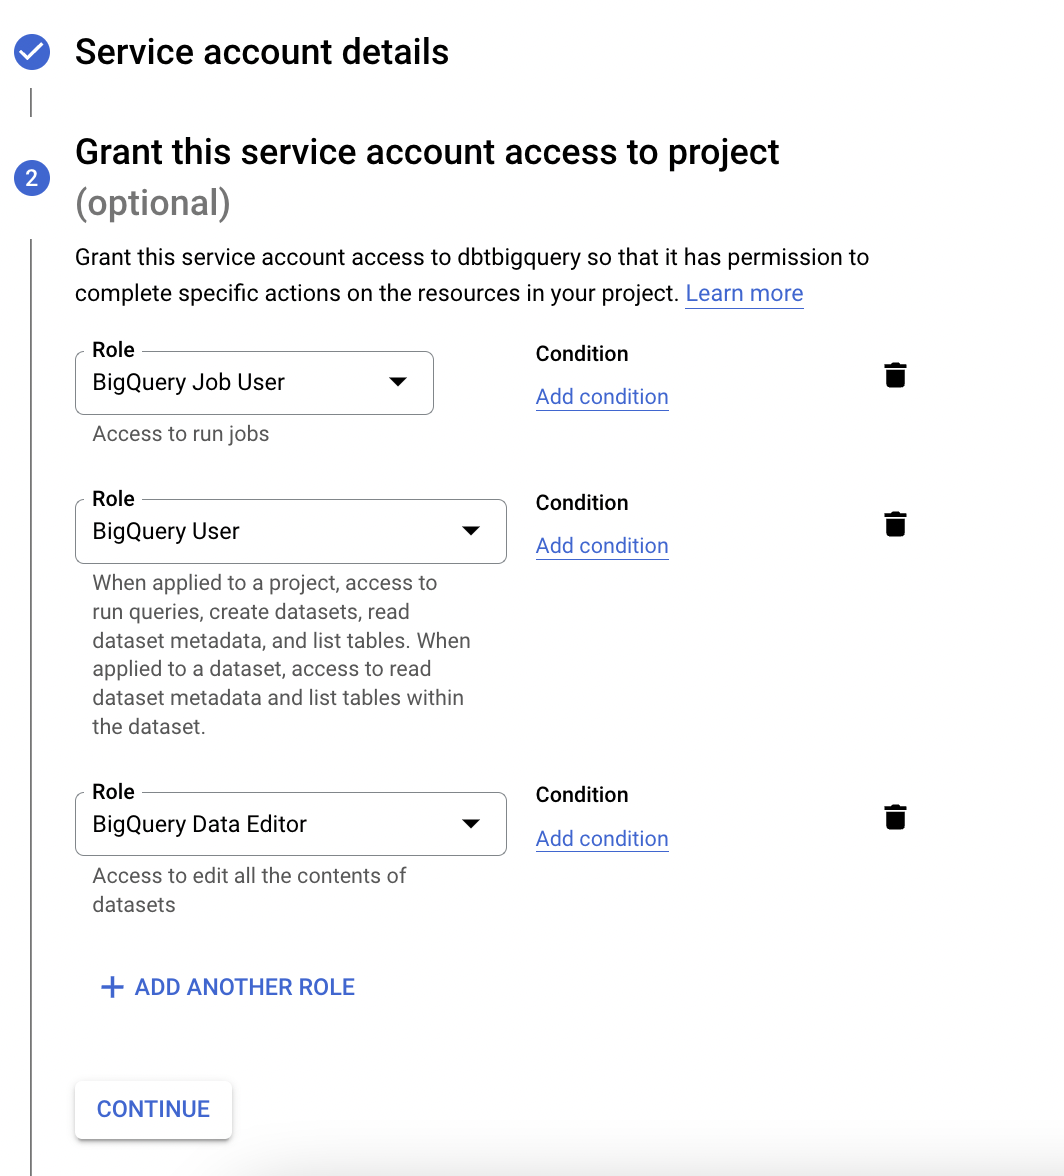
- Next, Google will prompt you to enter roles. Type and select `BigQuery Job User`, `BigQuery User` and `BigQuery Data Editor`.
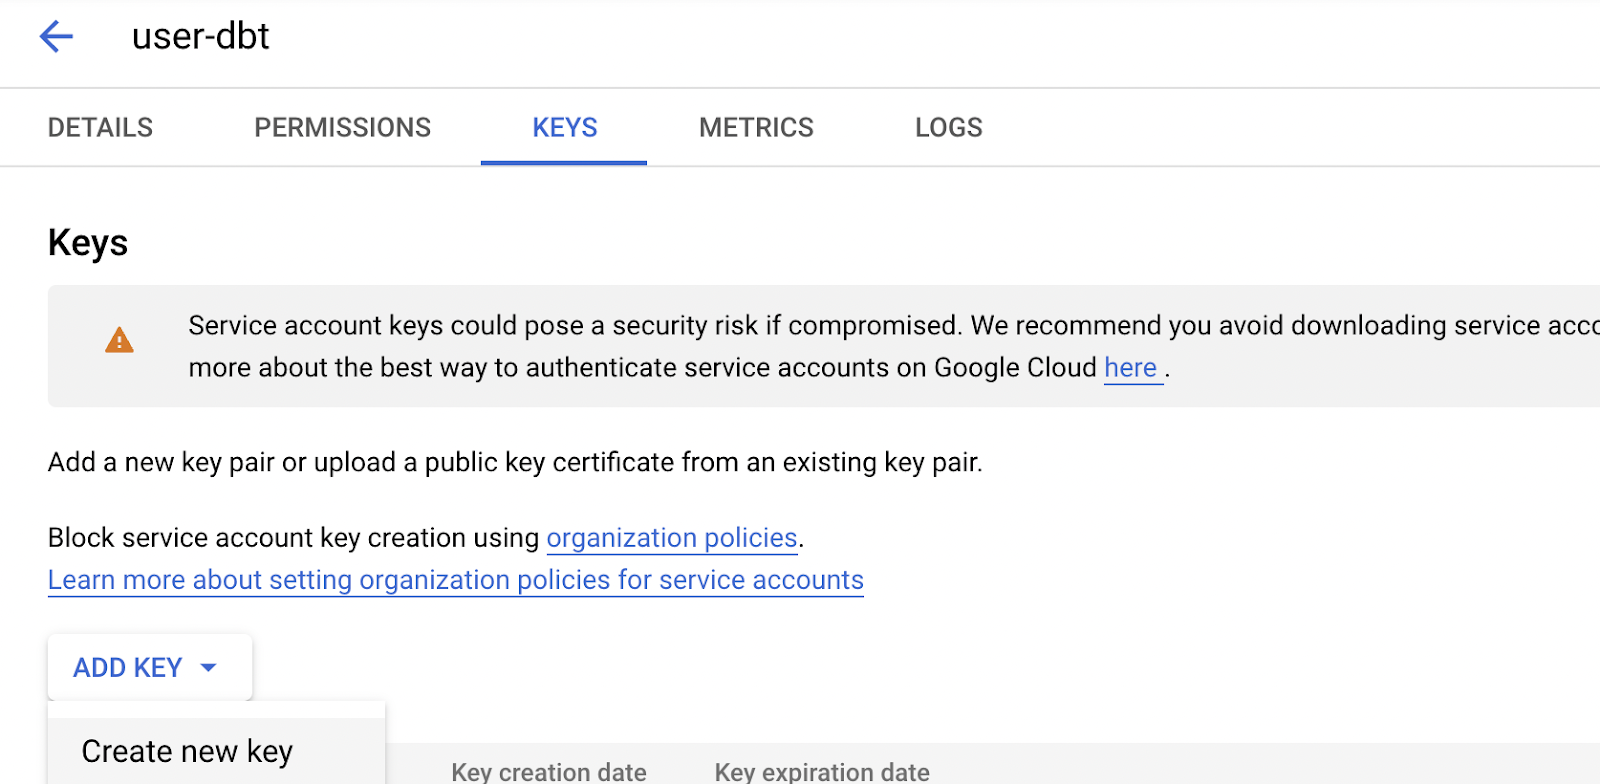
Now that you’ve created a service account with admin access to your BigQuery database, the next step is to generate the service account credentials so that you can authorize DBT to connect to your database. Select the service account, then select the ‘Keys’ tab, and click ‘Add Key’ followed by ‘Create New Key’.
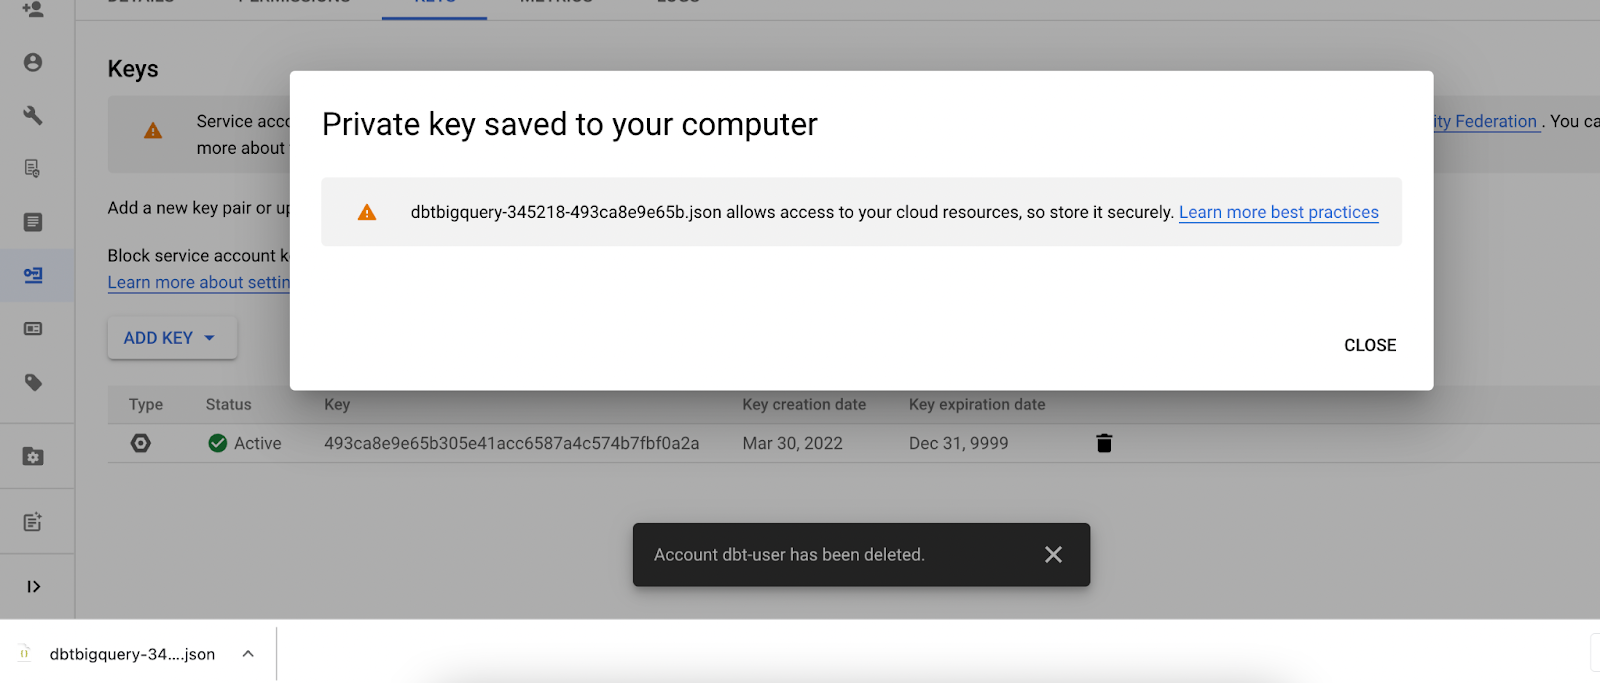
Clicking ‘Create New Key’ will generate a new JSON file that will have the credentials of the service account. This is what you’ll upload into DBT.
Go back to DBT, and click on the ‘Upload a Service Account JSON File’, and select the file you just downloaded.
When the file is uploaded, click the green test button in the top right to test that DBT can now connect to your database.
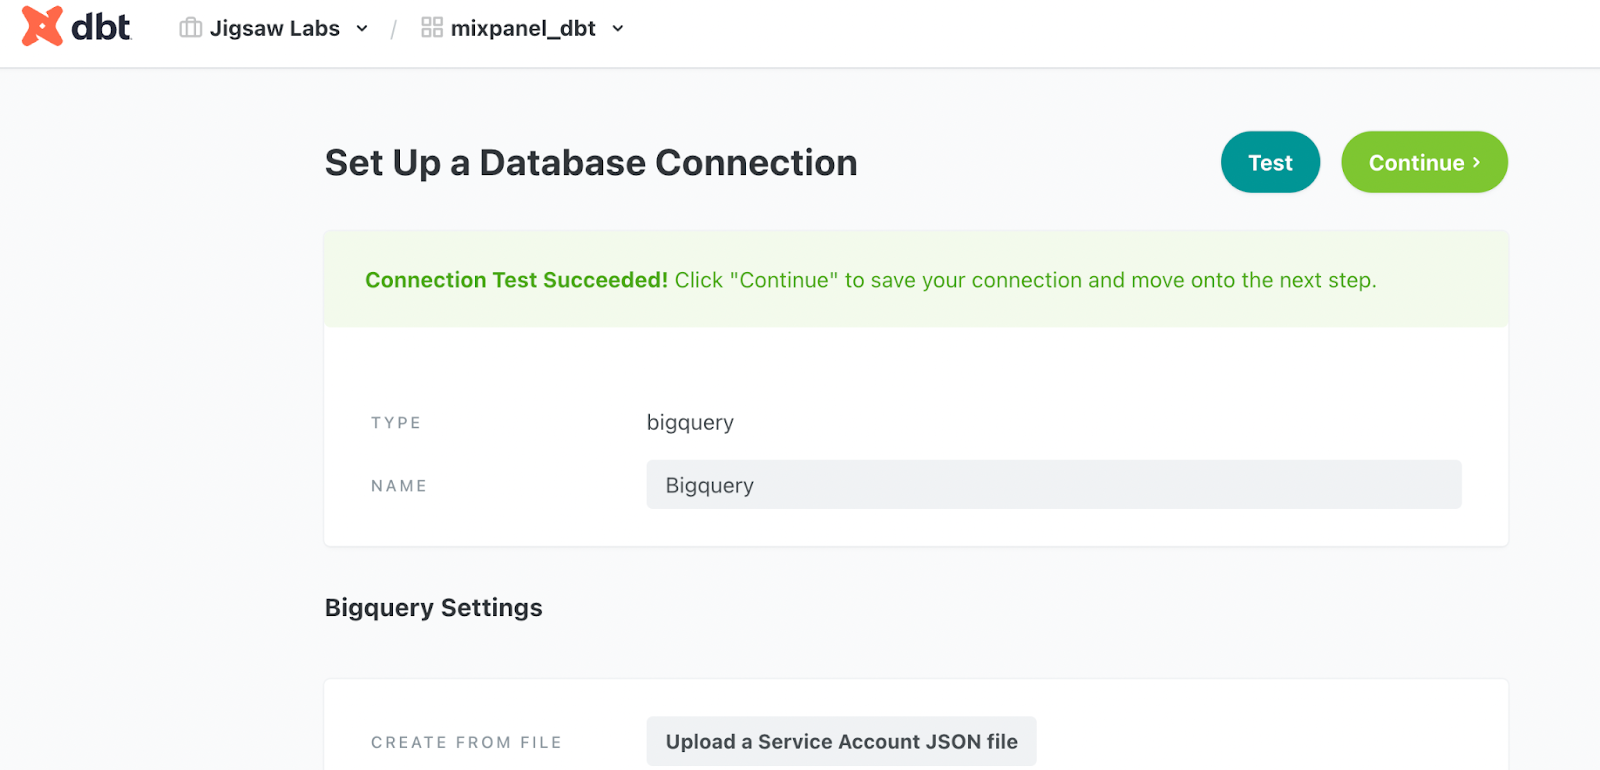
When you see that it has succeeded, click ‘Continue’.
The final step is to add a repository. To move onto this next step, it may be necessary to reselect the project from the drop down on top and then click ‘Continue’.
You could connect your repository to Github, but it’s a little easier to use a DBT managed repository so we’ll use that option in this tutorial. We’ll name the repository `mixpanel_dbt` to match our project name.
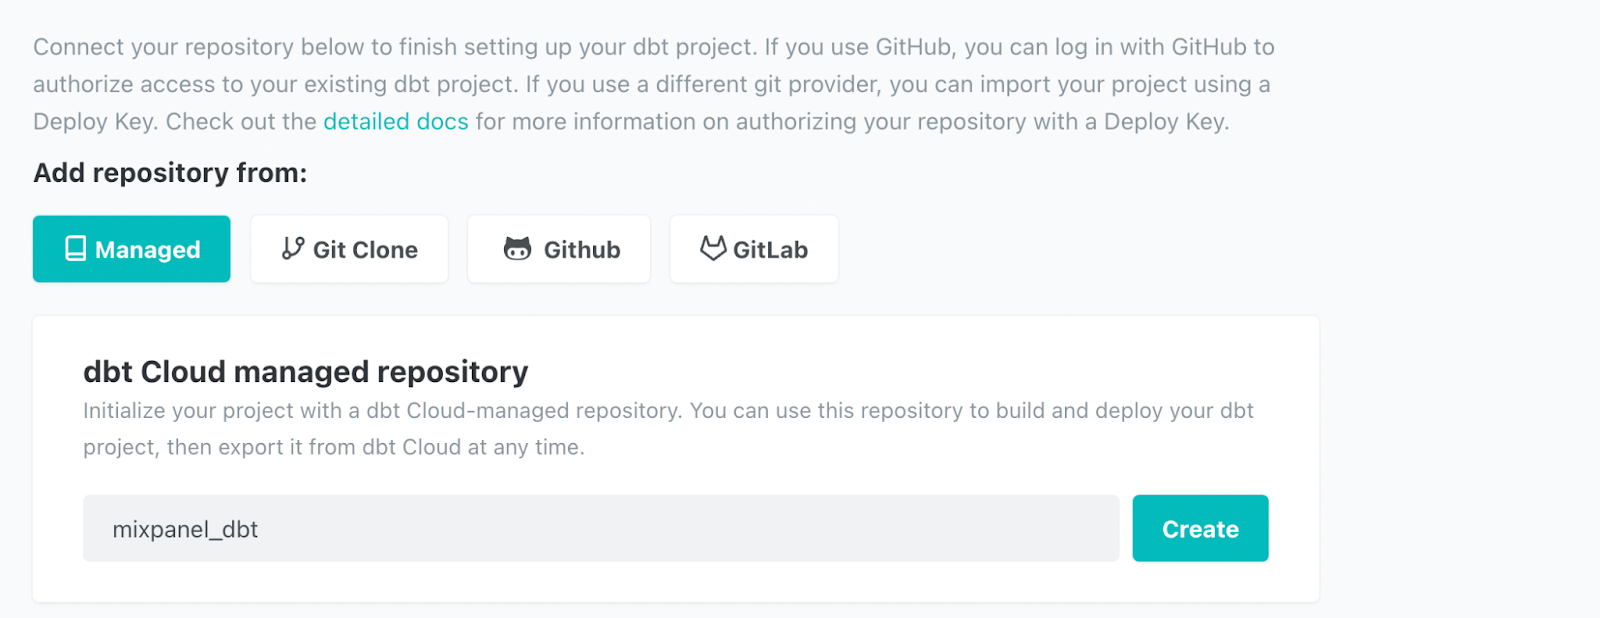
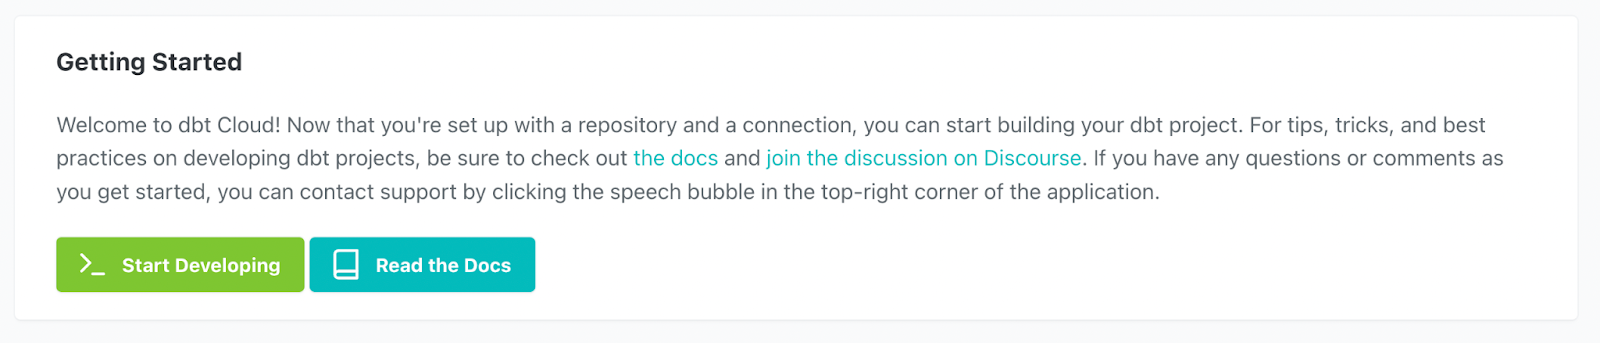
Once we click the ‘Create’ button, we are all set up! It’s time to implement SQL commands in DBT. Click on the ‘Start Developing’ button to get started.
Developing With DBT
Click on the green initialize project button in the top left. From there, you can see how you can query the database by creating a new file and adding a query like the following:
Then, clicking the preview button, you can see that we are connected to our BigQuery database.
Next, replicate the steps that you performed with BigQuery.
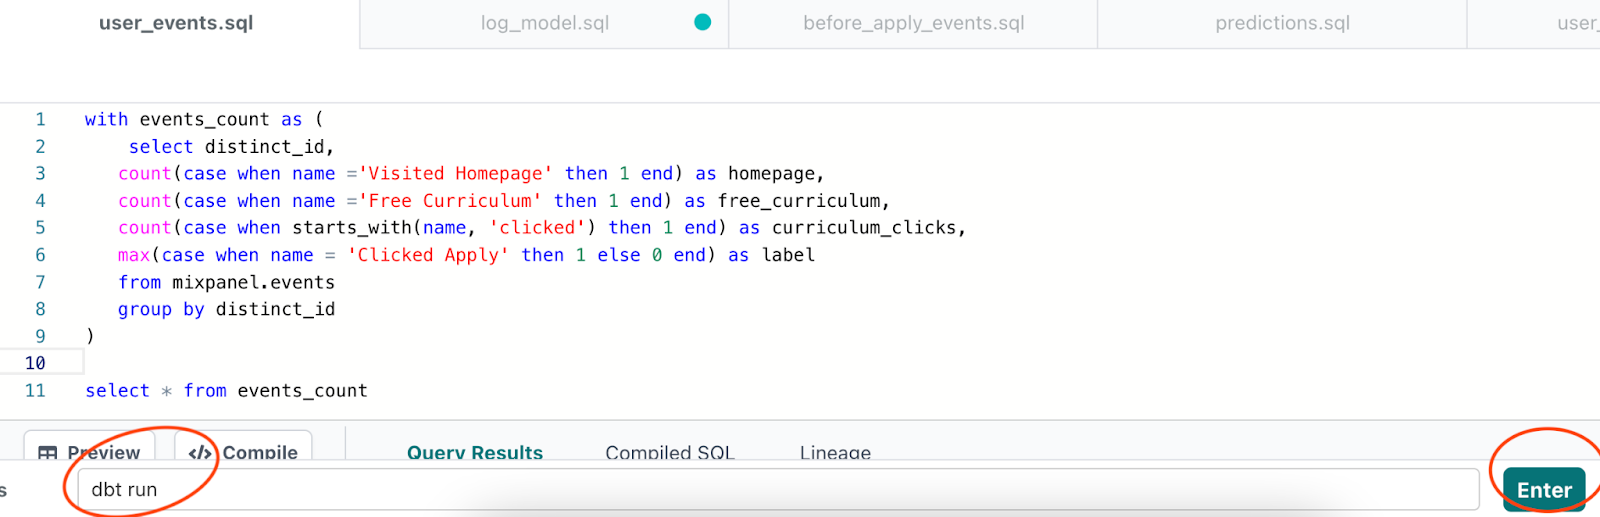
Create a new file under the `models` folder called `user_events` and add the following query.
Now with DBT, you can easily turn a query like the one above into a new table or view by calling DBT run in the command line at the very bottom and then pressing the green enter button on the bottom right.
DBT will bring up a console, and if you click on the details tab, you can see that DBT has just created a new table in BigQuery ML under a new schema that begins with `dbt_`.
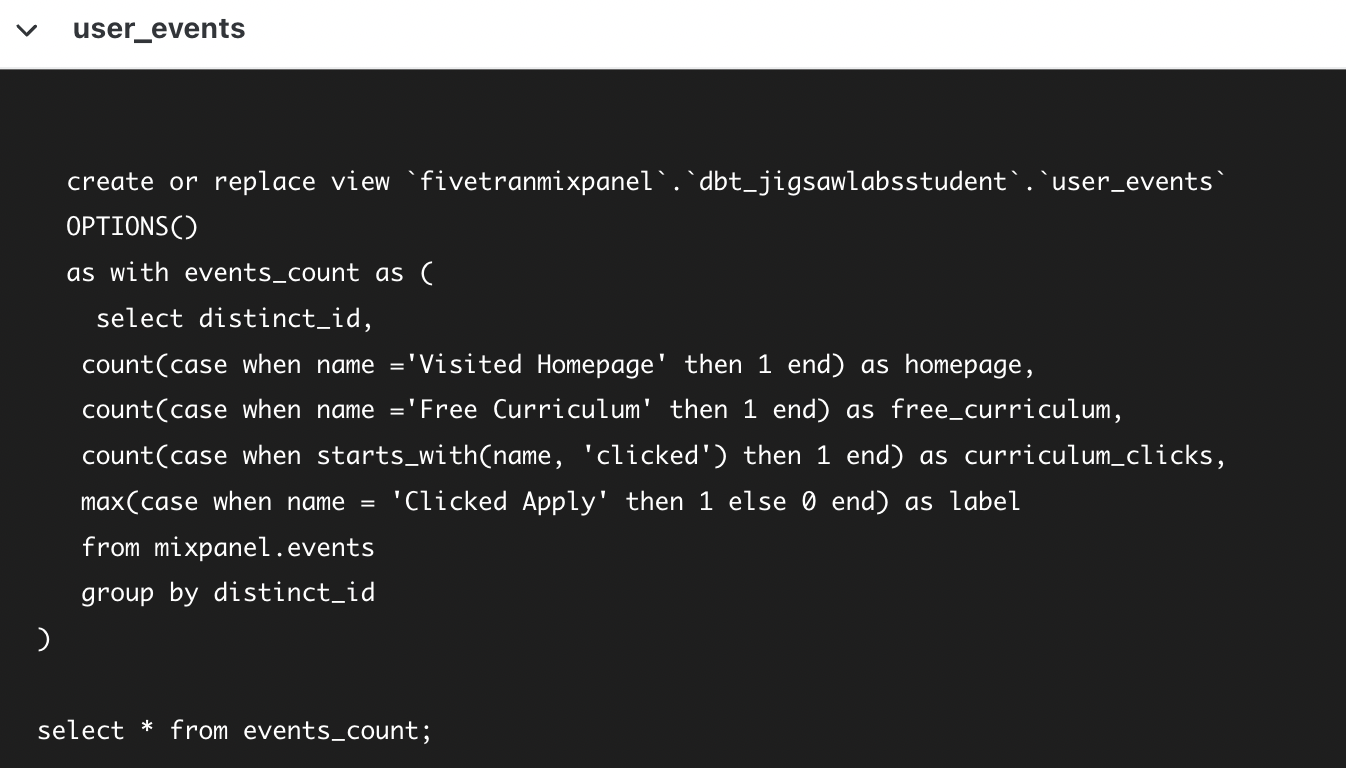
If you go to your BigQuery console, you’ll find a new view has been created.
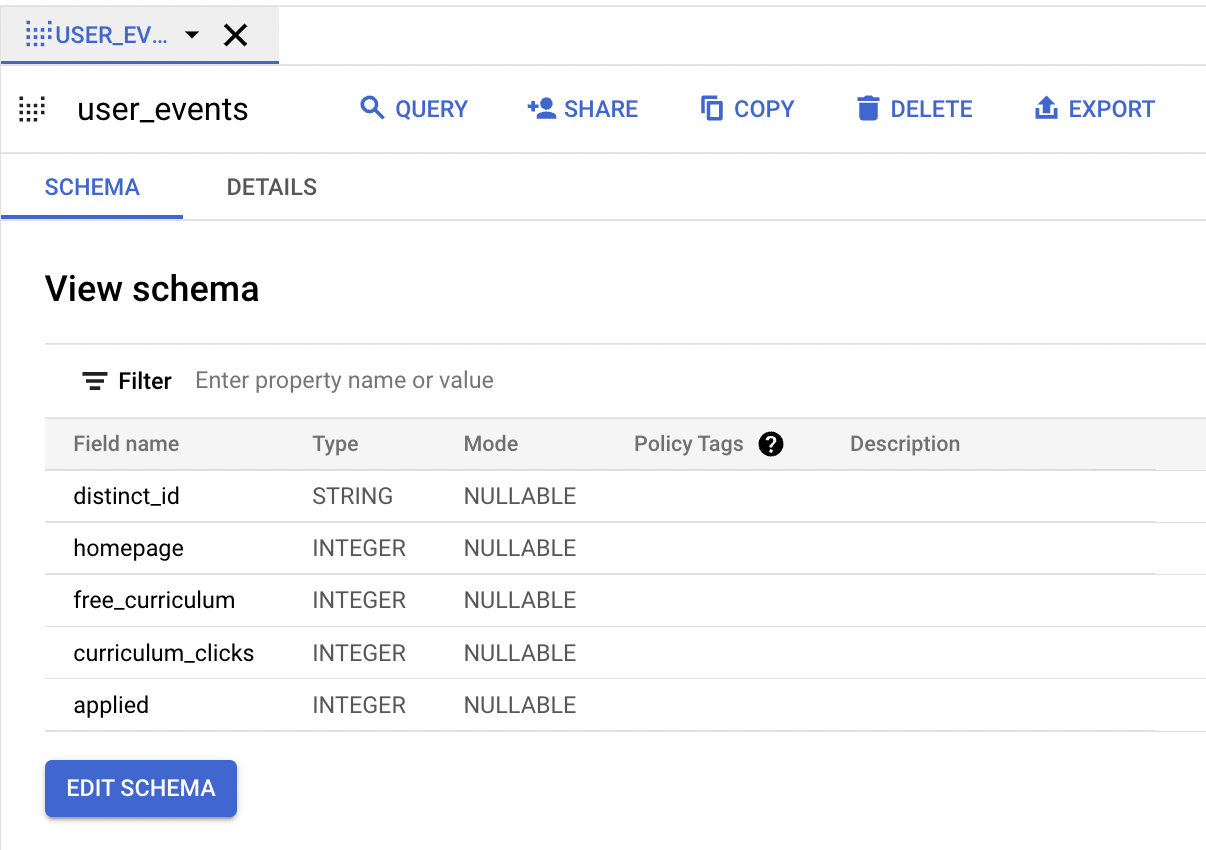
Notice that the table name is user_events. DBT looks at the name of your file, user_events.sql to determine the name of the created view.
Remember the purpose of this table is to perform some feature engineering to feed into your machine learning model. Create a new file for your machine learning model under the `models` folder called `log_model.sql`.
Now we’ll want our machine learning model to reference the user_events view that we just created. The best way to reference another DBT table is with the `ref` function. You’ll find this in your `log_model` file.
In your log_model file, for now, simply select * from the user_events table with the following:
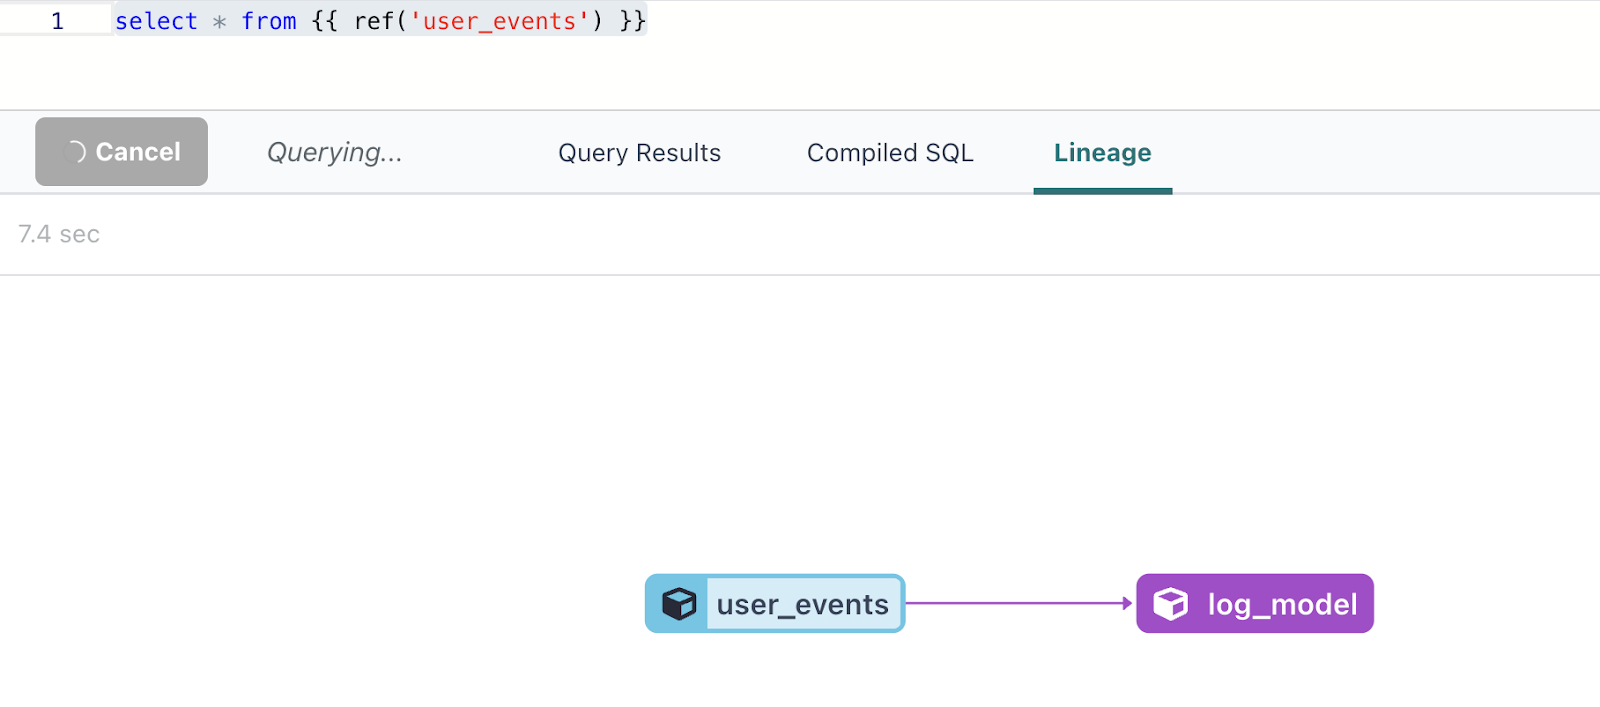
If you click over to the lineage tab, you can see that one of the benefits of this is that we have established that the log_model depends on the user events model. In other words, if you want to create the log_model, DBT will know that it will first need to check to see if there were any changes made to the user_events model, as it will take the user_events as an input.
Of course, what we really want to do is pipe the user_events into our Google ML model. And to accomplish this, we’ll use a DBT package called dbt_ml .
As mentioned on the DBT hub , you can install the package by adding the following to the packages.yml file.
packages:
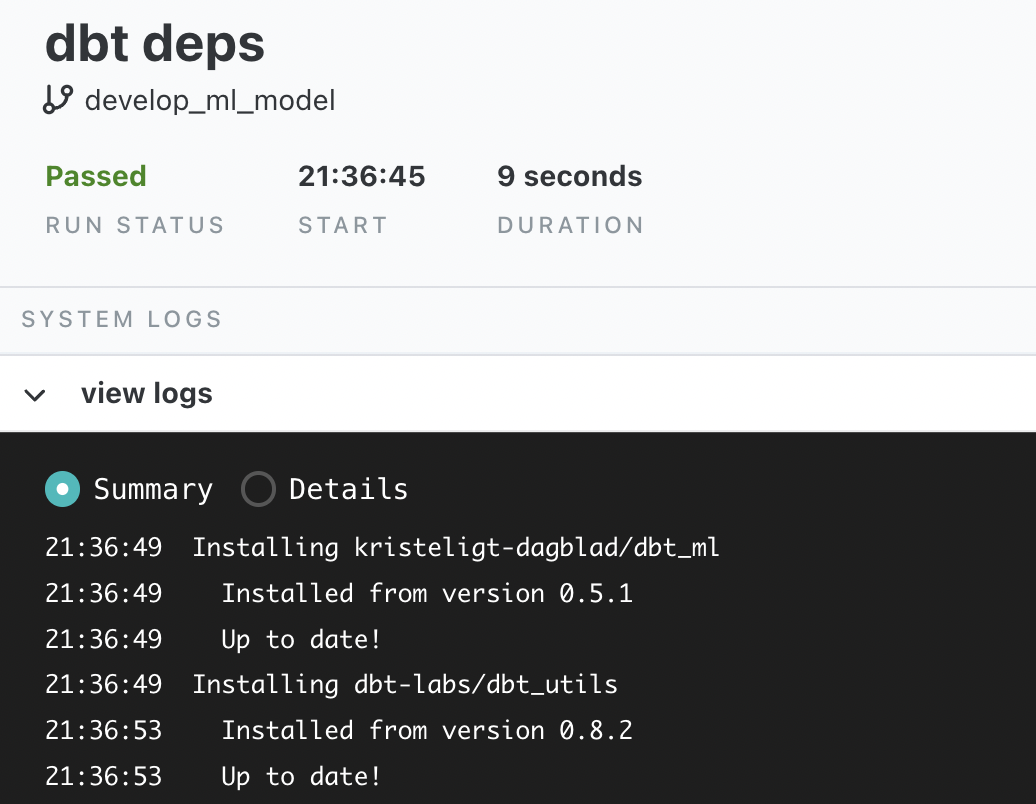
And then, in the DBT command line, run `dbt deps`.
Once the package is installed, follow the directcaions on the related github , by adding the following to the `dbt_project.yml` file in your DBT repository.
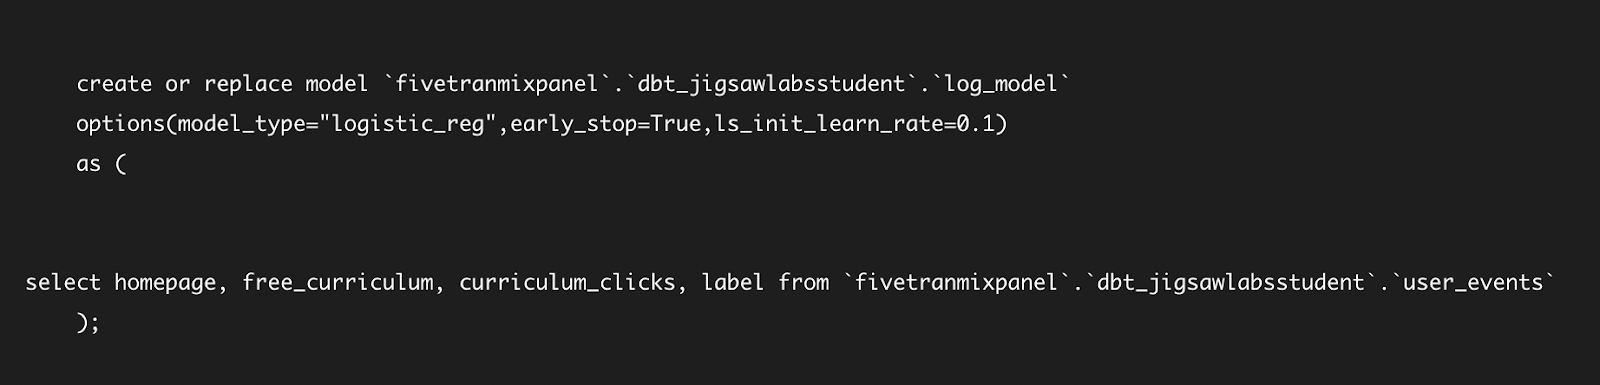
Continuing with the documentation in the dbt_ml github , change the log_model.sql file to the following.
Run the log_model by entering `dbt run –select log_model`, which will run the log_model’s dependency of user_events followed by the log_model.
If you look at the details of the DBT run, you’ll see that this generated and ran the SQL to create a BigQuery model, just like we previously entered directly into BigQuery ML.
In a separate predictions.sql file, you can make predictions from this trained model by adding the following:
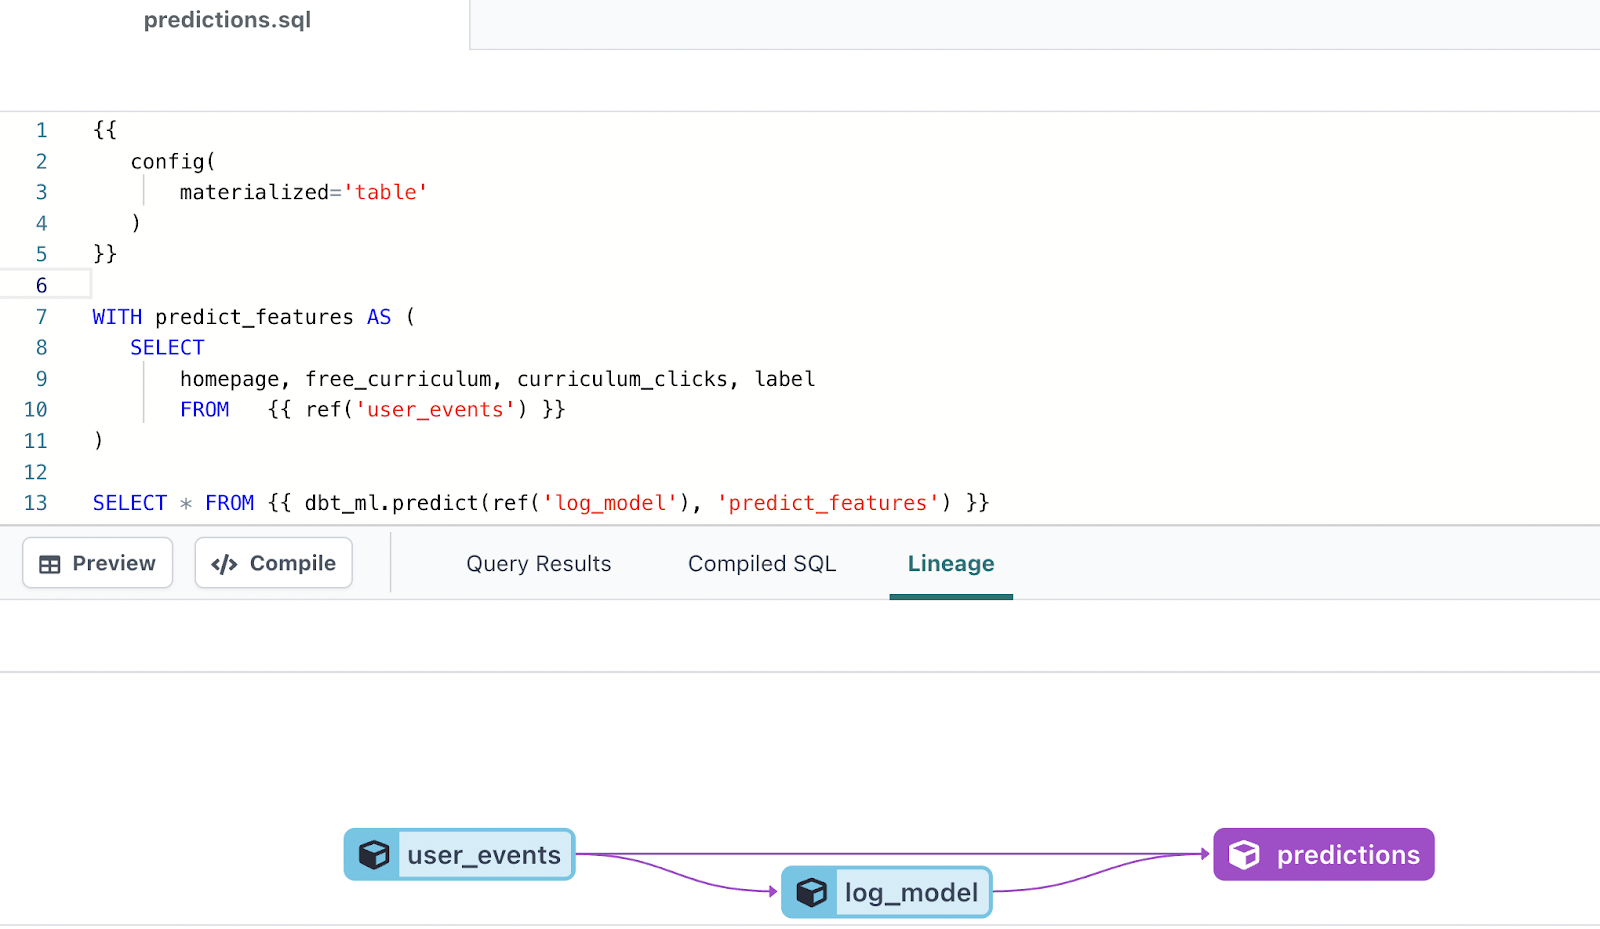
In our case, this selects the relevant columns of homepage, free_curriculum and curriculum clicks from the `user_events`, stores them in a CTE called predict_features, and then uses `dbt_ml.predict` to have our log_model predict on the data from the predict_features CTE.
Side note: There is an issue with both training and predicting on the same user_events data. If you would like to see a corrected version, please reference the github repository.
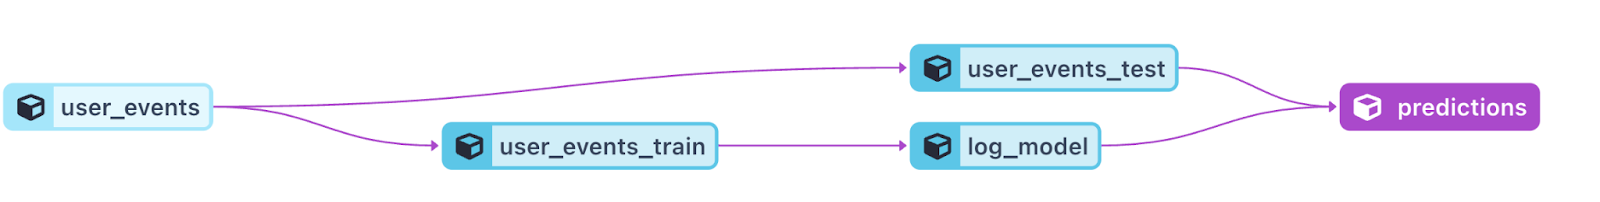
This DBT pipeline first performs some feature engineering in creating the user_events table, then trains the log_model, and then makes predictions from that trained model.
Call `dbt run –select predictions` in the command line, and from there, move over to the BigQuery to see the predictions.
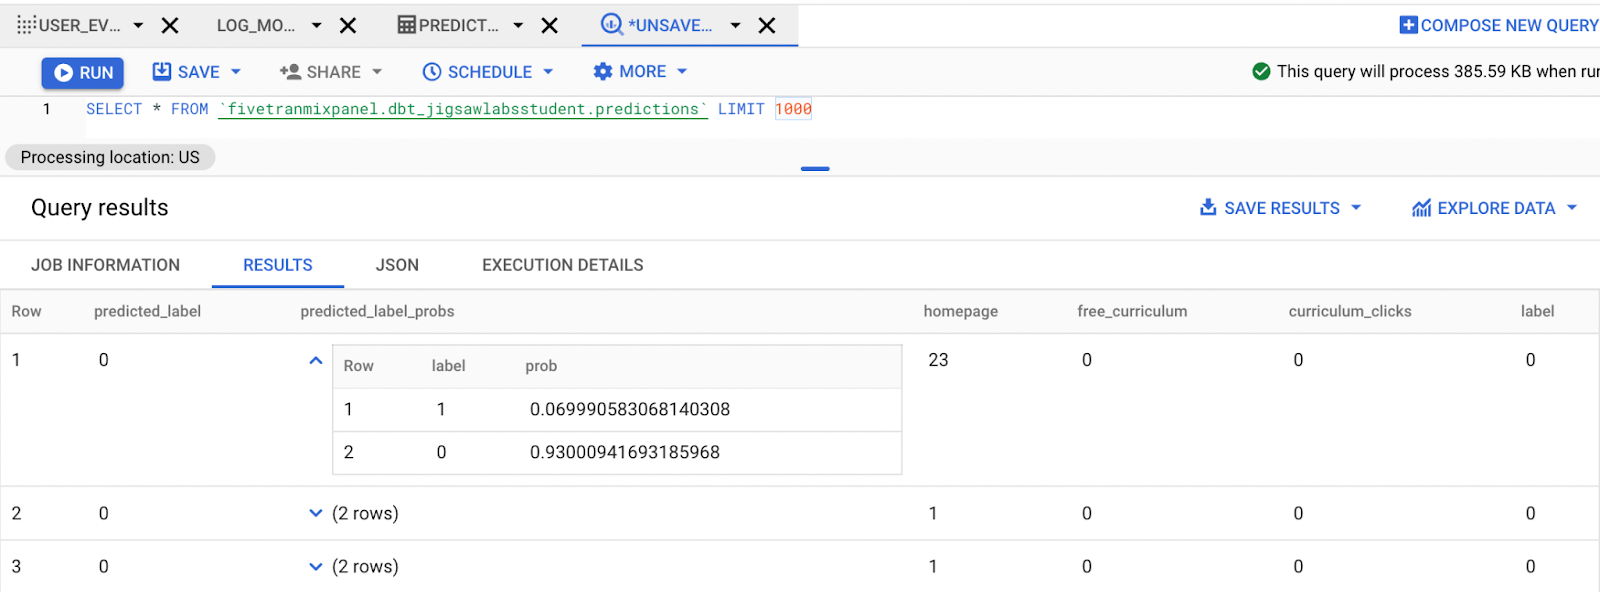
You can see that not only are there related predictions, but that we also have a probability associated with each prediction. For example, in the first record, DBT is predicting with .93 confidence that the observation has a label of 0.
The Benefits of DBT
You’ve now used DBT to build a data pipeline that performs feature engineering, uses that view to train a dataset and then makes predictions from that data. What are the benefits of using DBT?
DBT allows us to define the dependencies of each step so that it imposes a sequence to these steps. Maintaining this sequence will be valuable as more data is loaded and needs to move through the pipeline. Second, DBT places all of your code in an organized repository that can be shared with others. DBT has other features to enhance data pipelines like tests to ensure data and code quality, and built-in scheduling so that these steps can be performed regularly.
In the related DBT repository , the pipeline includes training and testing of the data, and the benefits of using a tool like DBT are even more pronounced.
Summary
We walked through how to set up a machine learning pipeline with DBT and BigQuery that predicts which users are most likely to apply to our program. Doing so would allow us to direct our sales team to reach directly out to our top leads, and can also allow us to determine which events lead visitors to apply to the program. By using BigQuery ML we developed this pipeline without the hassle of moving data out of our database, and by using DBT we developed a pipeline that performs feature engineering, trains a model, and then performs feature engineering.
Dive in
Related
Video
Building Machine Learning Models into Docker Images
By Luke Marsden • Aug 25th, 2021 • Views 830
Video
Building Machine Learning Models into Docker Images
By Luke Marsden • Aug 25th, 2021 • Views 830