

Monitoring ML models with FastAPI and Evidently AI

ML model Monitoring is a delicate phase in the MLOps lifecycle
December 6, 2022
Duarte Carmo
ML model Monitoring is a delicate phase in the MLOps lifecycle. Understanding how to implement monitoring is crucial in the development process. In this blog, Duarte shows how to monitor your ML model in production using Evidently AI.
I’ve deployed a good amount of ML models to production. For many, deployment to production is the last step of the process. Once that’s done, work is done. This is far from true. Once your model is out there, problems will start to arise. Some predictions will be wrong. Some labels will occur more often than they should, and some examples will surprise the model. Setting up the right lenses & triggers in your model is critical. It helps to ensure everything is running smoothly or to know when issues need to be tackled. Let’s open up the black box.
Setting up FastAPI
I’ve previously written about how to serve your ML model with FastAPI. Let’s assume we’re serving our model with FastAPI, and our src folder looks something like this:
The main.py file is where our views are defined. Below is our main file, with a /predict endpoint that serves predictions.
Prerequisite: Storing all predictions
To monitor our model, we must first make sure two things are happening:
- Prediction logging: We’re actively logging all predictions our model is making
- Access to a reference dataset: We have access to the dataset where our model was trained (e.g., the training data)
Logging all predictions your model makes can be done using some managed database service (e.g., think Aurora, BigQuery, etc.). Ideally, we want to do this without increasing our prediction latency.
Fortunately, Fast API provides a great tool to do this: BackgroundTasks. We start by creating a function that saves our data (in this example, to BigQuery):
We can now add it to our API as a background task:
Notice how the background task does not block the prediction time– allowing us to keep prediction latency as low as possible, while still saving all predictions.
Setting up the monitoring
Evidently is a great open-source tool that allows you to set up monitoring for your ML models. It’s not the only one, there’s a myriad of them, actually. nannyML is another one.
Evidently allows you to generate a bunch of different reports you can generate. In this example, I’ll focus on the Data Drift dashboard.
The Data Drift dashboard allows you to measure the difference in distribution between the predictions you are making, and the labels of your training set. When these two start to become significantly different, you are likely encountering some drift.
Alright, let’s build it. We start by creating a couple of functions in our monitoring.py module:
Now that we’re able to fetch both our reference data and our past predictions, we’re ready to build our Data Drift dashboard:
Notice how we’re creating our dashboard, and then saving it to a static/drift.html file. The idea is then to serve this dashboard in one of our FastAPI endpoints.
Monitoring dashboard
Let’s serve our data drift dashboard:
Every time we visit /monitoring, Fast API will run the generate_dashboard function and return an html file:
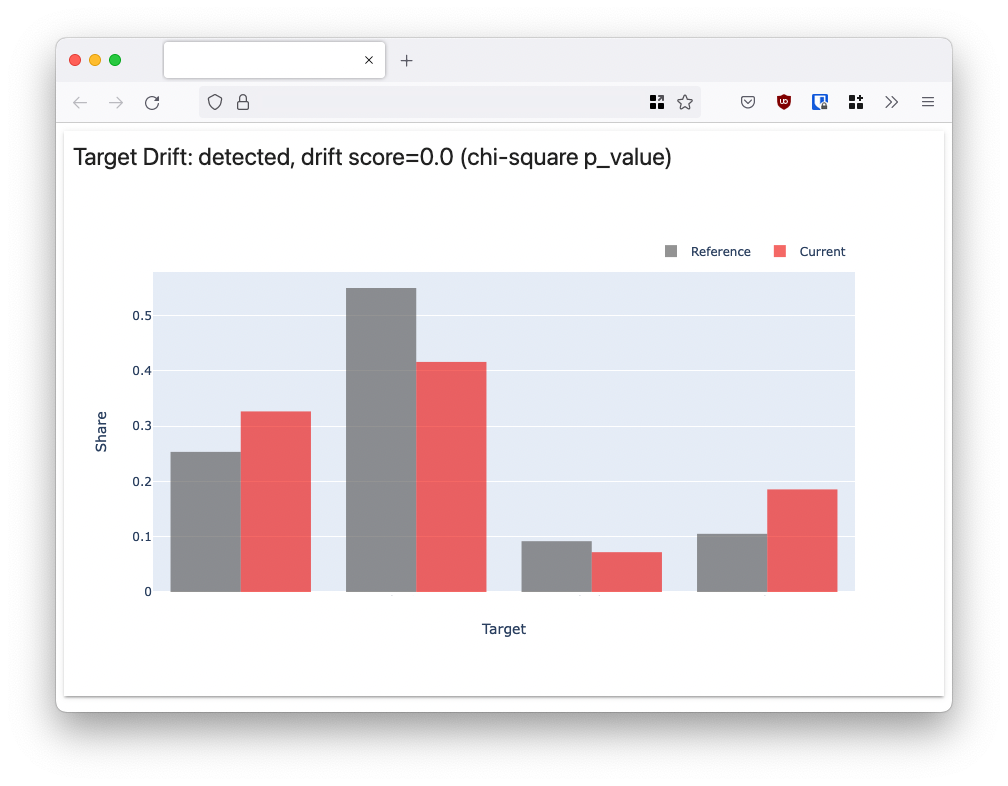
As you can see, this dashboard compares the distribution of our reference and current dataset. The current dataset is the latest Y predictions we’ve made.
Closing thoughts
I’ve found this to be a relatively straightforward way of adding a bit of visibility to what’s really happening in my production models. If those distributions are looking particularly skewed: you know it’s time to act.
Evidently allows us to generate much more than just a data drift dashboard. You can also generate dashboards to monitor data quality, the performance of a regression, classification performance, and many more. It’s worth taking a look at their docs to see what fits your use case best.
There’s a way we could increase the speed here. Instead of computing the entire dashboard every time we visit /monitoring, we could compute it every X time period in the background. This would result in much faster response from the /monitoring endpoint.
Is this dashboard enough to make sure everything is going well in production? No. But it’s a great first step towards figuring out what’s really going on.
Authors Bio: Duarte Carmo is a Technologist/hacker, born and raised in sunny Portugal, now based in Copenhagen. His work lies in the intersection of Machine Learning, Data, Software Engineering, and People. He is in love with Technology, and how it can improve people’s lives.
Dive in